Stock Analysis · Schlumberger NV (SLB)
Overview
Schlumberger NV, which now brands itself simply as SLB, is one of the world’s largest oilfield services and energy technology companies. It does not mainly produce oil and gas for its own account. Instead, it sells tools, software, engineering, and field services to energy producers and developers. In simple terms, SLB helps customers find hydrocarbons, drill wells, evaluate reservoirs, produce more efficiently, and increasingly manage carbon, geothermal, and digital energy operations.
Its business is global and spread across offshore, onshore, and international markets. That broad reach matters because customers range from national oil companies in the Middle East to major integrated producers and independent operators. Compared with many energy companies, SLB is less tied to the price of a single barrel of oil and more tied to industry spending on drilling, production, and reservoir management.
Based on recent annual reporting, revenue is primarily generated from four large divisions. Approximate shares can vary slightly by quarter, but the mix is broadly as follows:
- Production Systems: about 33% — equipment and systems used to bring oil and gas to the surface, including subsea production systems, surface equipment, valves, and processing-related technologies.
- Digital & Integration: about 29% — digital software, data solutions, exploration data, and integrated project management services where SLB can manage larger parts of a field development program.
- Reservoir Performance: about 22% — technologies and services that help measure, evaluate, and improve reservoir output, including well intervention and stimulation.
- Well Construction: about 16% — drilling tools, directional drilling, drilling fluids, and related services needed to build wells safely and efficiently.
This mix shows that SLB is not only a drilling contractor. A meaningful part of the company now comes from digital platforms, integrated services, and production equipment, which can make the revenue base more diversified than a pure pressure-pumping or rig-linked provider.
Over the last several years, revenue rose from roughly $23 billion in 2021 to about $36 billion in 2024 before easing modestly in 2025, while operating income and net income improved sharply versus the post-pandemic period. That pattern suggests a business that has rebuilt scale and profitability, even though it remains exposed to the usual ups and downs of energy spending.
The longer trend is encouraging: sales and gross profit expanded strongly from 2021 through 2024, and operating earnings grew even faster. The softer 2025 result shows that SLB is not immune to a slower spending environment, but the company remained solidly profitable and continued investing in research and development.
Key Figures
| Metric | Value | Sector ⓘ |
|---|---|---|
| Date | Oct 24, 2026 | |
| Context | ||
| Sector | Energy | |
| Industry | Oil & Gas Equipment & Services | |
| Market Cap ⓘ | $74.18B | |
| Beta ⓘ | 0.84 | |
Value (Cheapness) | ||
| P/E Ratio ⓘ | 24.14 | 15.40 |
| P/B Ratio ⓘ | 3.11 | 1.71 |
| FCF Yield ⓘ | 6.14% | 8.24% |
| Dividend Yield ⓘ | 2.36% | 3.52% |
| EBIT / EV ⓘ | 5.10% | 7.45% |
| PEG ⓘ | 1.37 | |
Growth (Business expansion) | ||
| Revenue Growth ⓘ | 5.00% | 26.85% |
| RPS Growth (5Y CAGR) ⓘ | 10.55% | 6.78% |
| EPS Growth (5Y CAGR) ⓘ | -17.29% | -14.41% |
| BVPS Growth (5Y CAGR) ⓘ | 12.88% | 6.08% |
| Margin Growth (5Y Trend) ⓘ | 1.96% | 0.55% |
| FCF Growth (5Y CAGR) ⓘ | 6.96% | 2.75% |
| DPS Growth (5Y CAGR) ⓘ | 21.76% | 16.79% |
Quality (Business durability) | ||
| ROIC (Latest) ⓘ | 9.30% | 11.30% |
| ROA (Latest) ⓘ | 5.56% | 6.00% |
| ROIC (5Y Median) ⓘ | 15.28% | 10.35% |
| ROA (5Y Median) ⓘ | 8.13% | 5.46% |
| Net Debt / EBIT (Latest) ⓘ | 2.29 | 1.64 |
| Net Debt / EBIT (5Y Median) ⓘ | 1.77 | 1.82 |
| Net Debt / EBITDA (Latest) ⓘ | 1.41 | 1.08 |
| Net Debt / Assets ⓘ | 18.11% | 17.29% |
| EBITDA / Interest ⓘ | 13.97 | 9.53 |
| Operating Margin (Latest) ⓘ | 12.06% | 16.21% |
| Operating Margin (5Y Median) ⓘ | 16.95% | 20.55% |
| Debt to Equity (Latest) ⓘ | 49.08% | 52.27% |
| Profit Margin (Latest) ⓘ | 8.53% | 8.79% |
| Free Cash Flow (Latest) ⓘ | $4.55B | |
Momentum (Price trend) | ||
| 3Y Return ⓘ | -5.17% | +68.93% |
| 12M Return (excl. last month) ⓘ | +54.01% | +42.90% |
| 6M Return ⓘ | -2.15% | +9.18% |
| Price vs. 200-Day MA ⓘ | +0.62% | +9.87% |
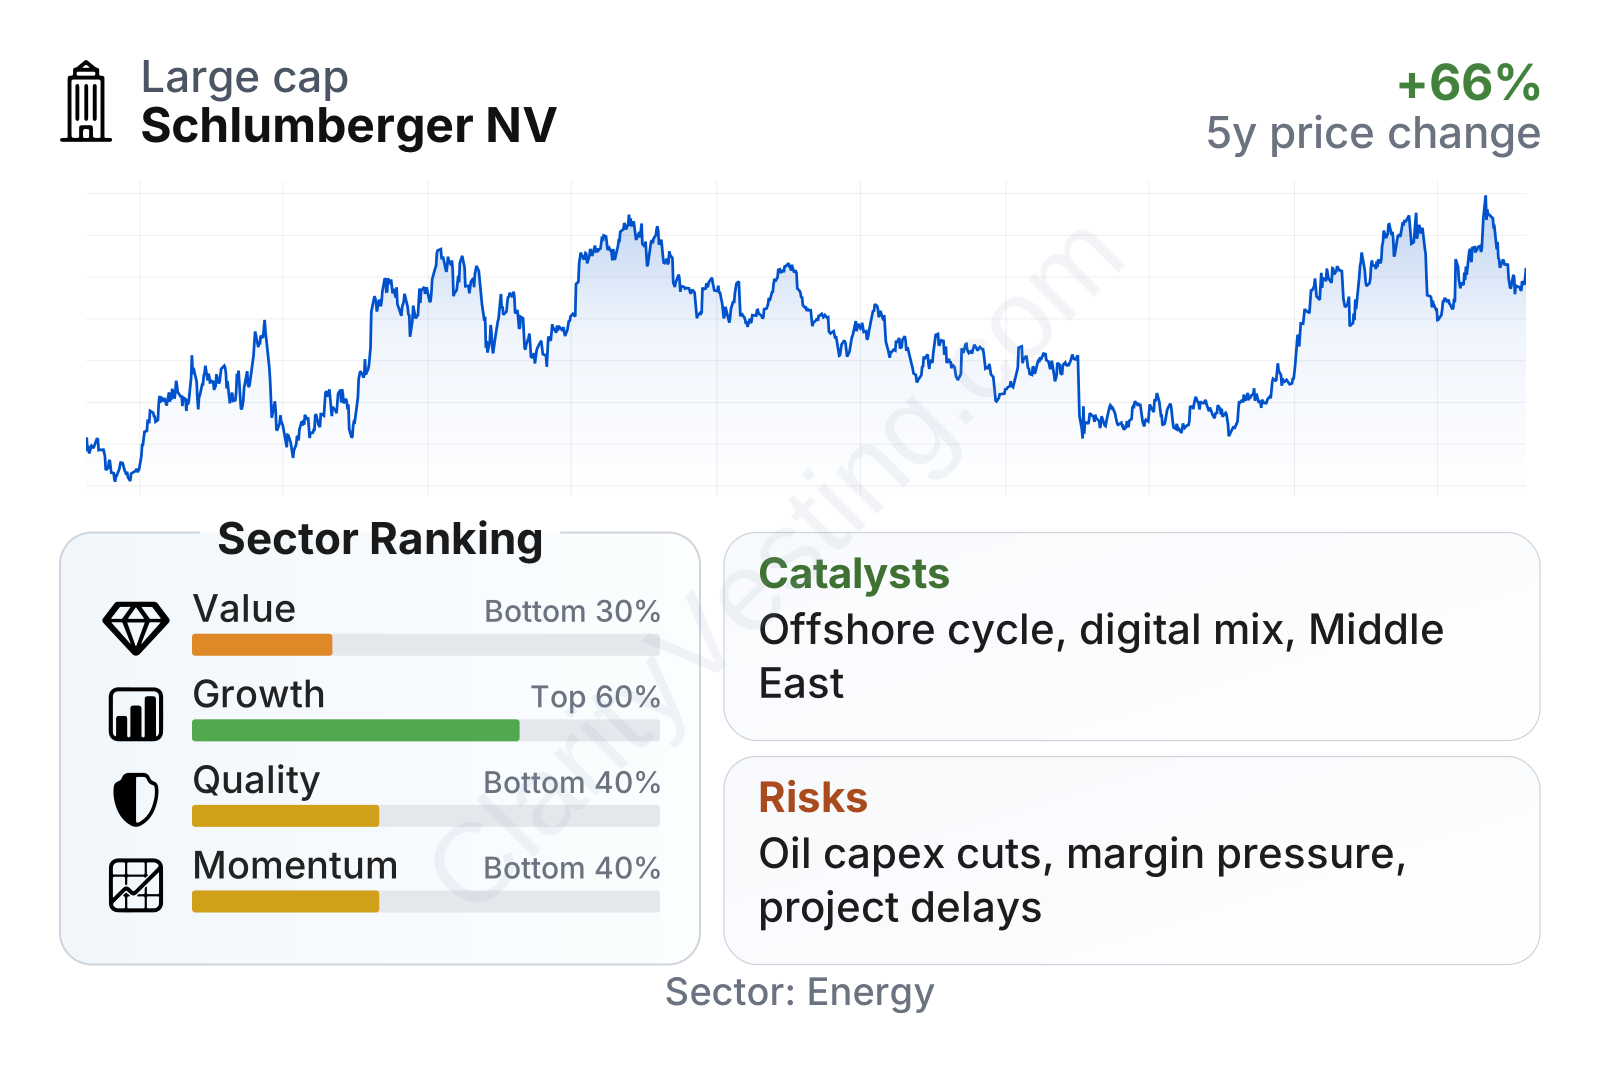
SLB is a very large energy services company, and its share price history reflects that cyclical background: a strong recovery after 2021, a weaker stretch in 2024 and 2025, and a rebound into 2026. In the factor summary, growth metrics are generally better than the sector median over a multi-year view, while value metrics look weaker, meaning the market is still assigning SLB a richer multiple than many peers. Quality is mixed: leverage is manageable and interest coverage is strong, but current returns on capital and margins are not at the top of the sector.
Growth
SLB operates in a sector that remains essential to the global economy, even as the energy system broadens beyond traditional oil and gas. The core oilfield services market is cyclical, but it is not disappearing. Global energy demand, the decline rates of existing reservoirs, and the need for new offshore and international projects continue to support long-cycle investment. This is especially important for SLB because international and offshore activity tends to be more durable than short-cycle North American shale spending.
The company’s strategy for future growth is relatively clear. First, it continues to focus on higher-margin international and offshore markets, where complex projects often require advanced technology and integrated execution. Second, it is building a larger digital business through software, subsurface data, and automation tools. Third, it is expanding into adjacent energy technologies such as carbon capture, geothermal, and related low-carbon infrastructure. Those newer areas are still much smaller than the legacy business, but they fit naturally with SLB’s engineering and subsurface expertise.
Recent revenue growth has cooled versus the surge seen in 2022 and 2023. After several quarters of double-digit expansion, growth slowed materially in 2024, turned negative for part of 2025, and then returned to low single digits by late 2025 and mid-2026. That pattern points to a business moving from recovery mode into a more mature phase of the cycle. It is not a sign of structural failure, but it does mean future gains may depend more on market share, technology mix, and project quality than on a broad industry upswing.
Cash generation remains one of the stronger parts of the picture. Free cash flow improved meaningfully from earlier periods and has stayed in the multi-billion-dollar range, even with some moderation recently. That matters for a capital-intensive industry because it gives SLB room to fund research, support dividends, repurchase shares, and maintain balance-sheet flexibility without depending too heavily on new borrowing.
A meaningful recent catalyst is the continued importance of Middle East and offshore development, where national oil companies and major producers are still investing in capacity and recovery efficiency. SLB is well placed here because these projects typically reward scale, technology depth, and global execution. Another catalyst is the push toward digitalization in field operations, where software and automation can help operators lower costs and improve recovery. This is one of the few areas in energy services where growth can be tied not only to drilling volumes but also to productivity upgrades.
Risks
This article is for informational purposes only and does not constitute financial advice. Some content is AI-generated. See Disclaimer


