Stock Analysis · SS&C Technologies Holdings Inc (SSNC)
Overview
SS&C Technologies Holdings is a software and services company focused on the financial services and healthcare industries. In simple terms, it helps large organizations run important back-office and customer-facing operations: portfolio accounting, fund administration, trading and compliance workflows, retirement and wealth management processing, and healthcare payment and care-management systems. Its clients include asset managers, hedge funds, private markets firms, banks, insurers, retirement-plan providers, and healthcare organizations.
The business model is built around recurring revenue. A large share of sales comes from software subscriptions, platform fees, and long-term service contracts tied to core operational systems that are costly and disruptive for customers to replace. That gives SS&C a steadier revenue base than many software businesses that rely heavily on one-time sales.
Based on the company’s recent annual reporting structure, revenue is mainly split between software-enabled services for financial clients and software/services for healthcare clients. Exact percentages can move from year to year, but the mix is broadly concentrated as follows:
- Wealth & Investment Technologies and Services: approximately 70% to 75% of revenue. This includes software, fund administration, transfer agency, portfolio and accounting systems, compliance tools, retirement solutions, and outsourced operations for investment managers and financial institutions.
- Healthcare Technologies and Services: approximately 25% to 30% of revenue. This includes healthcare claims and payment solutions, pharmacy and benefits-related technology, and care-management platforms.
Over the last several years, the company’s overall revenue has moved up from a little above $5.0 billion to more than $6.2 billion, while operating income has remained strong. The financial flow also shows a business with sizable gross profit and durable operating profitability, although interest expense has been a meaningful drag because the company carries a relatively high debt load.
The broad picture is a company with sticky customer relationships, strong margins, and a large recurring revenue base, but one that still needs to balance growth ambitions with leverage management.
Key Figures
| Metric | Value | Sector ⓘ |
|---|---|---|
| Date | Sep 12, 2026 | |
| Context | ||
| Sector | Technology | |
| Industry | Software - Application | |
| Market Cap ⓘ | $18.84B | |
| Beta ⓘ | 1.09 | |
Value (Cheapness) | ||
| P/E Ratio ⓘ | 22.68 | 29.51 |
| FCF Yield ⓘ | 9.36% | 4.25% |
| EBIT / EV ⓘ | 5.82% | 2.85% |
| PEG ⓘ | 0.74 | |
Growth (Business expansion) | ||
| Revenue Growth ⓘ | 10.30% | 15.40% |
| RPS Growth (5Y CAGR) ⓘ | 7.01% | 8.56% |
| EPS Growth (5Y CAGR) ⓘ | -9.79% | -11.88% |
| Margin Growth (5Y Trend) ⓘ | -2.26% | 0.46% |
| FCF Growth (5Y CAGR) ⓘ | 6.52% | 9.80% |
Quality (Business durability) | ||
| ROIC (Latest) ⓘ | 8.51% | 9.44% |
| ROIC (5Y Median) ⓘ | 7.91% | 8.30% |
| Net Debt / EBIT (Latest) ⓘ | 4.88 | 0.54 |
| Net Debt / EBIT (5Y Median) ⓘ | 4.86 | 0.44 |
| Operating Margin (Latest) ⓘ | 22.93% | 9.58% |
| Operating Margin (5Y Median) ⓘ | 23.07% | 8.25% |
| Debt to Equity (Latest) ⓘ | 117.12% | 33.33% |
| Profit Margin (Latest) ⓘ | 13.16% | 7.14% |
| Free Cash Flow (Latest) ⓘ | $1.76B | |
Momentum (Price trend) | ||
| 3Y Return ⓘ | +52.37% | +45.48% |
| 12M Return (excl. last month) ⓘ | -5.60% | +23.48% |
| 6M Return ⓘ | +13.09% | +20.93% |
| Price vs. 200-Day MA ⓘ | +7.40% | +7.43% |
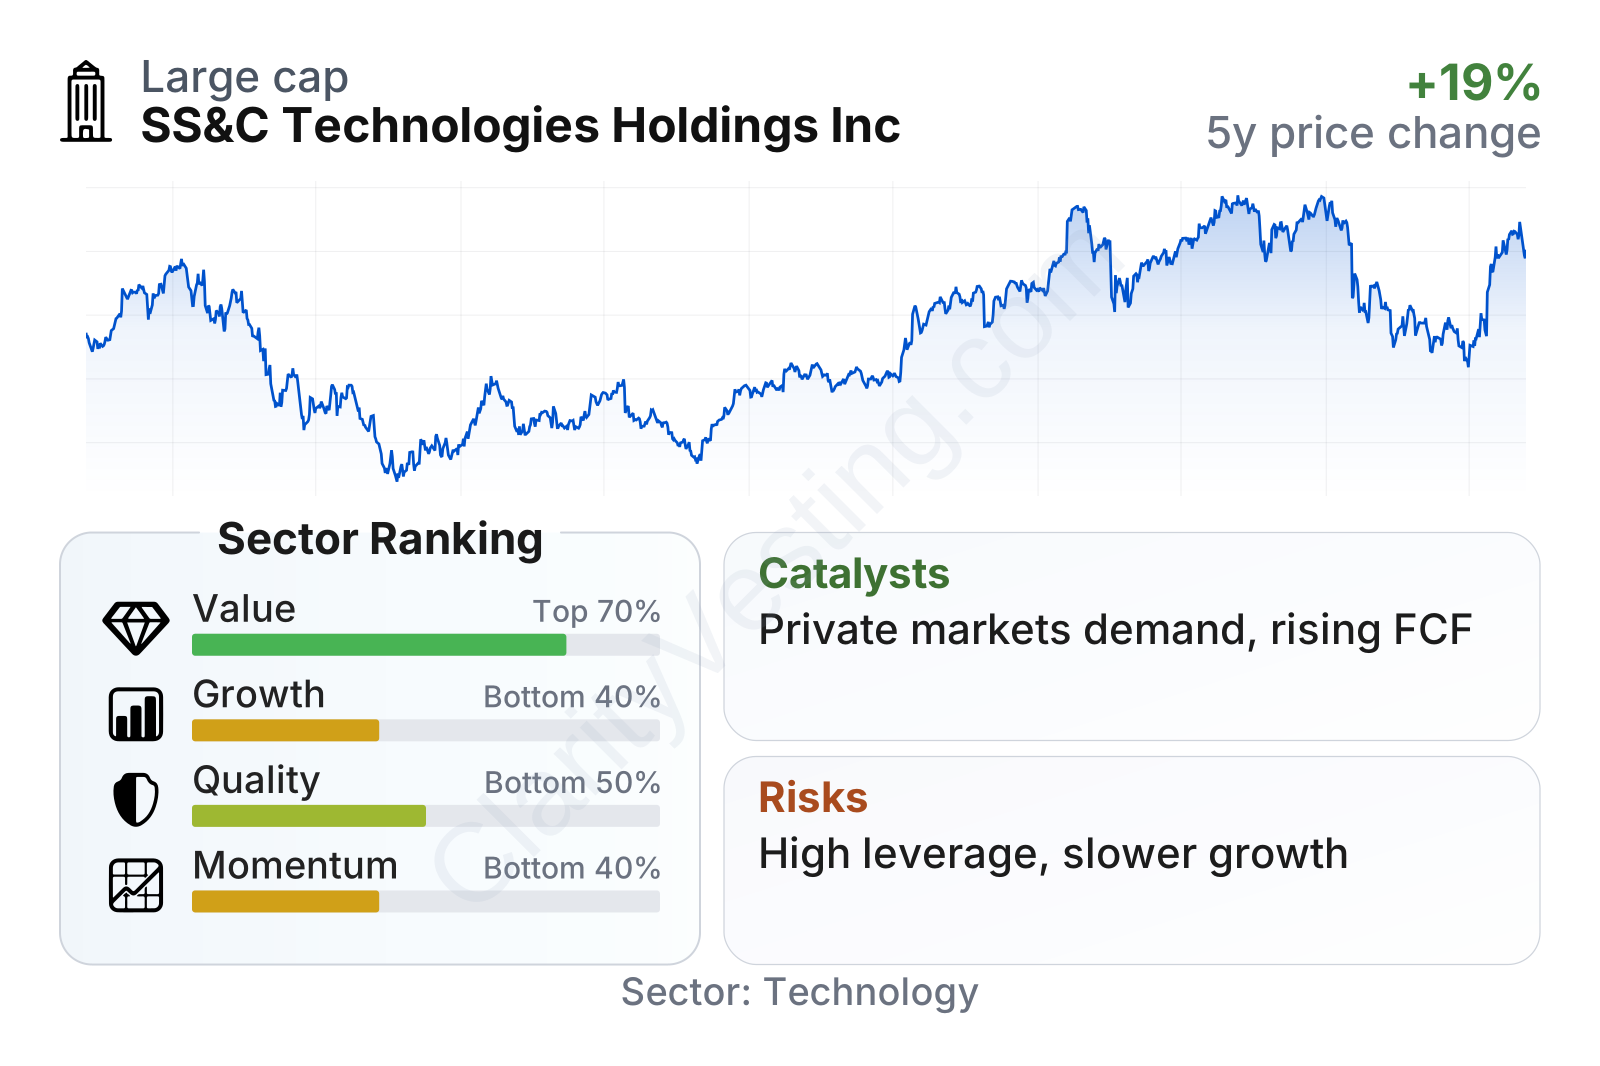
SS&C sits in the large-cap range and has share-price volatility close to the broader market. The most notable feature in the latest snapshot is the contrast between strong cash generation and profitability on one side, and slower-than-sector growth and heavier leverage on the other. Relative to much of the application software sector, the stock’s earnings multiple is lower, while free cash flow yield and operating earnings relative to enterprise value look stronger. Momentum, however, has been weaker, reflecting a softer recent stock performance.
Growth
SS&C operates in markets that still have room to expand over the long term. Financial institutions continue to outsource non-core operations, automate compliance and reporting, and modernize older software. In healthcare, payers and providers are under pressure to improve efficiency, manage cost, and digitize administration. These are favorable structural trends because they support demand for platforms that can reduce manual work and handle complex regulation.
The company’s strategy is also coherent for this environment. It combines software with outsourced services, which can deepen client relationships and raise switching costs. That matters in areas like fund administration and healthcare workflows, where customers often want fewer vendors and more integrated platforms. SS&C has also used acquisitions for many years to add capabilities, expand into adjacent niches, and cross-sell products to existing customers.
Recent growth has not been explosive, but it has improved. Year-over-year revenue growth had slowed into the low-single-digit range in parts of 2023, then accelerated through 2024, 2025, and into 2026, recently reaching around 10%. That is still below the median pace of the broader software sector, but the direction is encouraging because it suggests demand has been firming rather than fading.
Cash generation is one of the more important positives. Free cash flow has climbed sharply from the weaker period seen in 2023 and 2024 and is now running at roughly $1.7 billion to $1.8 billion on a trailing basis. For a company like SS&C, this matters because strong cash flow can support debt reduction, acquisitions, and continued product investment at the same time.
One recent opportunity worth watching is the continuing demand for private markets, retirement, and fund-administration technology. These areas are operationally complex and often difficult for clients to manage internally. If SS&C continues to win outsourcing mandates and broaden platform usage among existing customers, growth can come from both new business and deeper penetration of its installed base.
Risks
This article is for informational purposes only and does not constitute financial advice. Some content is AI-generated. See Disclaimer


