Stock Analysis · Solstice Advanced Materials Inc (SOLS)
Overview
Solstice Advanced Materials Inc operates in specialty chemicals and advanced materials, supplying products used in industrial, electronics, infrastructure, and other performance-driven applications. In simple terms, it makes high-value materials that help customers improve durability, processing, efficiency, or product performance. The business sits inside the broader basic materials sector, but it is more specialized than a commodity chemical producer because pricing and customer relationships depend not only on raw materials, but also on formulation know-how, quality consistency, and application support.
Based on the company’s recent annual financial profile, revenue appears to come primarily from product sales rather than service income or licensing. Public financial statements available for the latest full year show total revenue of about $3.9 billion, with profitability still meaningful at the operating level but under pressure at the net income level.
Publicly available filing detail does not clearly provide a reliable segment split precise enough to present a ranked percentage breakdown by business line without risking overstatement. What can be stated with confidence is that the company’s revenue is overwhelmingly tied to specialty material and chemical product sales, while smaller contributions may come from related technical support, formulation partnerships, or other ancillary commercial activity where disclosed.
Over the last four full years, sales rose gradually from roughly $3.6 billion to nearly $3.9 billion, but the mix of costs became less favorable. Gross profit stayed relatively stable while cost of revenue increased, and net income fell much more sharply than revenue. That pattern suggests Solstice is still selling more, but keeping less of each dollar after production, operating, and financing costs.
The financial flow highlights a business that has continued to grow its top line modestly, yet margins have narrowed. Operating income has declined from the very strong levels seen a few years ago, and net income has compressed even more, showing that revenue growth alone has not translated into stronger bottom-line performance.
Key Figures
| Metric | Value | Sector ⓘ |
|---|---|---|
| Date | Oct 10, 2026 | |
| Context | ||
| Sector | Basic Materials | |
| Industry | Specialty Chemicals | |
| Market Cap ⓘ | $9.73B | |
| Beta ⓘ | N/A | |
Value (Cheapness) | ||
| P/E Ratio ⓘ | 46.42 | 17.36 |
| P/B Ratio ⓘ | 6.07 | 1.73 |
| FCF Yield ⓘ | 1.85% | 5.81% |
| Dividend Yield ⓘ | 0.26% | 1.98% |
| EBIT / EV ⓘ | 6.08% | 6.34% |
| PEG ⓘ | 0.51 | |
Growth (Business expansion) | ||
| Revenue Growth ⓘ | 11.10% | 11.15% |
| RPS Growth (5Y CAGR) ⓘ | 2.67% | 4.49% |
| EPS Growth (5Y CAGR) ⓘ | N/A | -12.80% |
| BVPS Growth (5Y CAGR) ⓘ | -32.76% | 5.49% |
| Margin Growth (5Y Trend) ⓘ | -9.50% | -1.54% |
| FCF Growth (5Y CAGR) ⓘ | N/A | 0.20% |
| DPS Growth (5Y CAGR) ⓘ | N/A | 5.91% |
Quality (Business durability) | ||
| ROIC (Latest) ⓘ | 9.51% | 9.26% |
| ROA (Latest) ⓘ | 3.76% | 4.92% |
| ROIC (5Y Median) ⓘ | N/A | 7.82% |
| ROA (5Y Median) ⓘ | N/A | 3.88% |
| Net Debt / EBIT (Latest) ⓘ | 2.48 | 1.37 |
| Net Debt / EBIT (5Y Median) ⓘ | -0.33 | 1.70 |
| Net Debt / EBITDA (Latest) ⓘ | 1.86 | 0.92 |
| Net Debt / Assets ⓘ | 28.07% | 13.56% |
| EBITDA / Interest ⓘ | 11.57 | 12.28 |
| Operating Margin (Latest) ⓘ | 16.39% | 13.20% |
| Operating Margin (5Y Median) ⓘ | 21.31% | 11.82% |
| Debt to Equity (Latest) ⓘ | 152.02% | 39.91% |
| Profit Margin (Latest) ⓘ | 5.13% | 6.43% |
| Free Cash Flow (Latest) ⓘ | $180.00M | |
Momentum (Price trend) | ||
| 3Y Return ⓘ | N/A | +68.93% |
| 12M Return (excl. last month) ⓘ | +32.09% | +36.53% |
| 6M Return ⓘ | -21.99% | 0.00% |
| Price vs. 200-Day MA ⓘ | -12.77% | -0.18% |
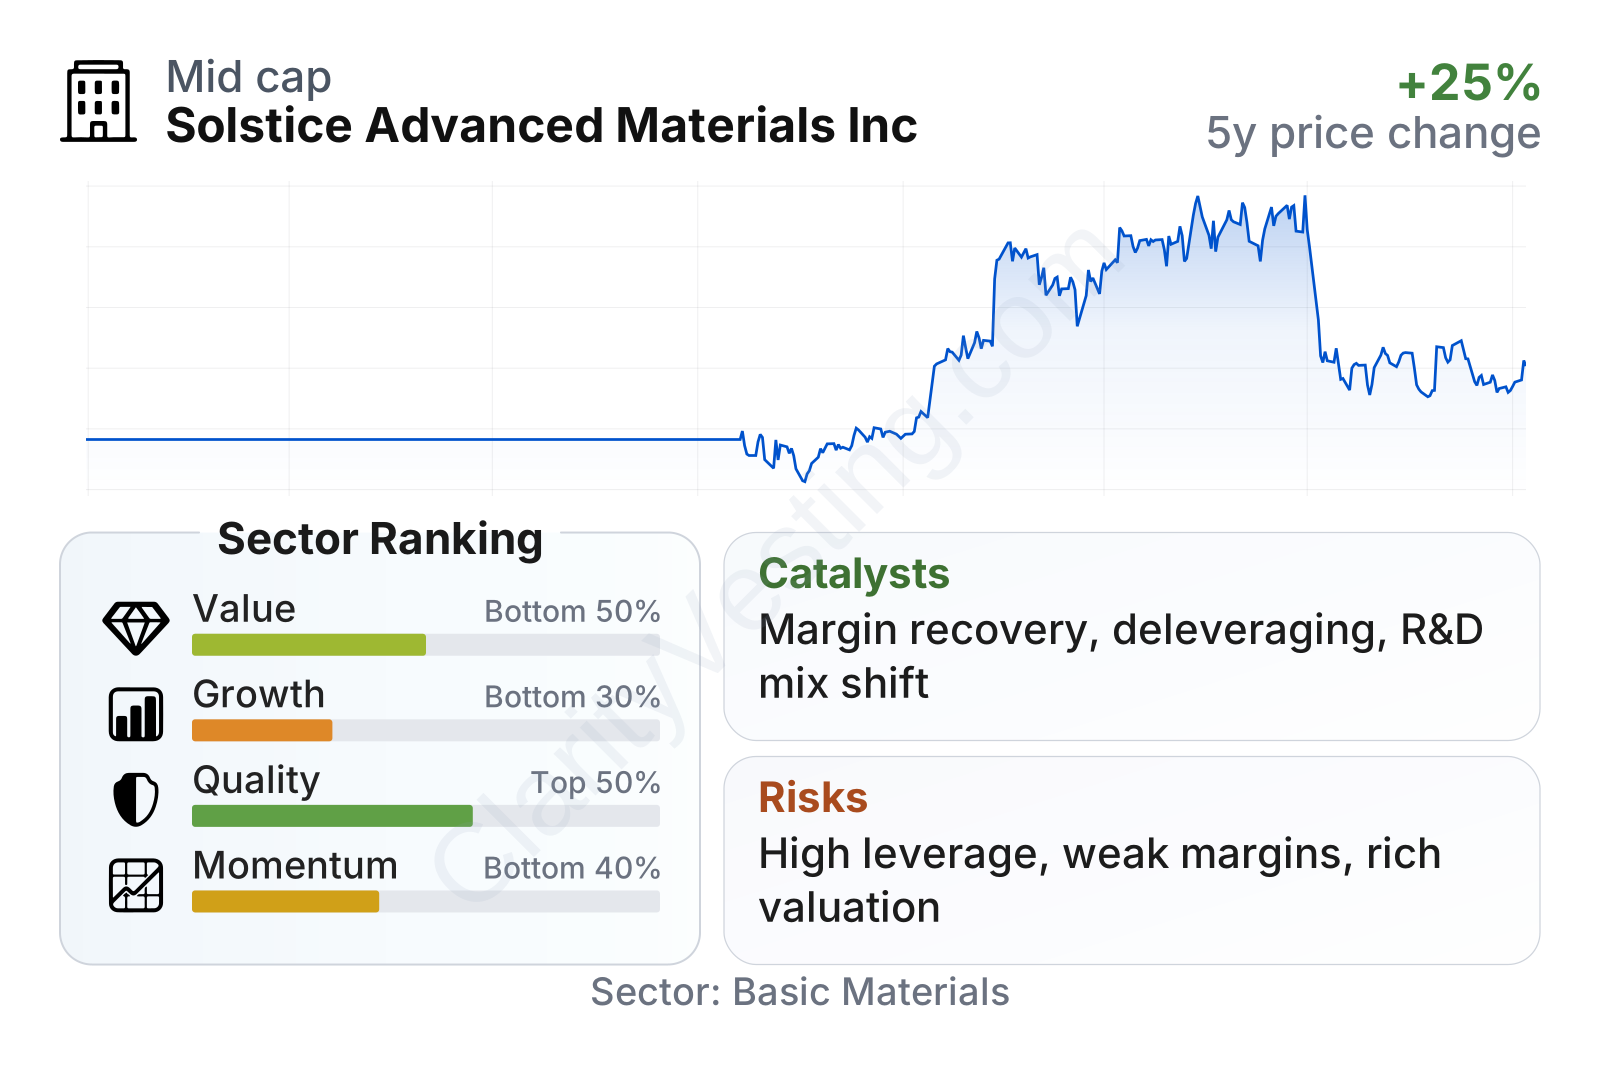
Solstice is a mid-to-large specialty chemicals company with a market value around the low tens of billions of dollars. The stock has been volatile in recent months: it climbed strongly into spring 2026, then gave back a meaningful part of that move by mid-summer. That fits the broader picture shown in the metrics table: quality is around the middle of the sector, but value, growth, and momentum rank below average.
Profitability is mixed. Operating margin remains stronger than the sector median, and return on invested capital is slightly above the sector median, which indicates the core business still has some economic strength. However, free cash flow yield is modest, net leverage is elevated, and valuation multiples such as price-to-earnings and price-to-book are well above typical sector levels. In other words, the business is not weak operationally, but the market still assigns it a relatively rich price compared with current earnings and asset value.
Growth
Specialty chemicals is generally a growth-capable area of materials because customers often require higher-performance products for lighter vehicles, more advanced electronics, cleaner industrial processes, stronger infrastructure materials, and more demanding manufacturing standards. This does not make the sector immune to cycles, but it does create room for companies with differentiated formulations and long customer relationships to expand faster than commodity chemical producers over time.
Solstice’s own growth profile is more moderate than the sector backdrop might suggest. Recent year-over-year revenue growth has been around 11%, roughly in line with the sector median, but longer-term revenue-per-share growth has trailed the sector. The more concerning point is that margin trends over the last five years have moved in the wrong direction. That means the company has been able to expand sales, but not as efficiently as before.
The strategic logic still makes sense if management can stabilize costs and improve mix. In specialty materials, growth often comes from moving toward higher-value applications rather than simply shipping higher volume. If Solstice can keep investing in research and development while defending its operating margin, it has a path to better growth quality. R&D spending has remained present and has gradually increased over the last several years, which at least shows continued support for product development instead of aggressive short-term cutting.
A notable potential catalyst is the gap between operating performance and market sentiment. The stock has weakened over the last six months and is trading below its 200-day average, even though revenue has still been advancing. If future quarterly results show better conversion of sales into earnings and cash flow, that mismatch could narrow. Another potential opportunity is balance-sheet improvement: debt-to-equity has been trending down in 2026, which may reduce financial pressure if the direction continues.
Risks
This article is for informational purposes only and does not constitute financial advice. Some content is AI-generated. See Disclaimer