Stock Analysis · SoFi Technologies Inc (SOFI)
Overview
SoFi Technologies is a digital financial services company built around a simple idea: offer banking, borrowing, investing, and financial tools through one app-driven platform. What began mainly as a student loan refinancing business has expanded into a broader consumer finance ecosystem. Today, SoFi offers personal loans, student loan products, home loans, checking and savings accounts, credit cards, investing services, and a technology platform used by other financial institutions.
The business is organized into three main segments: Lending, Financial Services, and Technology Platform. Lending is still the economic engine of the company, while Financial Services and Technology Platform are meant to deepen customer relationships and make SoFi less dependent on any single lending category over time. That mix matters for long-term analysis because it shows SoFi is trying to become more like a full-service digital financial brand rather than a niche lender.
Based on the company’s recent reporting structure, SoFi’s revenue base is led by lending-related activity, with additional contributions from fee-based financial products and its technology arm.
- Lending: approximately 75% to 80% of total net revenue. This includes personal loans, student loans, home loans, loan sales, and interest income generated by holding loans.
- Technology Platform: approximately 10% to 15% of total net revenue. This primarily includes Galileo and Technisys, which provide payments, core banking, and account-processing infrastructure to other businesses.
- Financial Services: approximately 10% to 15% of total net revenue. This includes SoFi Money products, brokerage and investing, credit cards, and other member-oriented financial offerings.
The broad direction is clear: SoFi still earns most of its money from lending, but it is working to build a more diversified platform where deposits, payments, investing, and financial infrastructure become larger contributors over time.
The long-term trend has been strong top-line expansion, with revenue rising from a little over $1 billion in 2021 to nearly $4.8 billion in 2025. Profitability has also improved meaningfully: operating losses and net losses gave way to positive operating income and positive net income by 2024, and that progress continued in 2025. The main point is that SoFi is no longer only a growth platform spending heavily to scale; it has already crossed an important profitability threshold.
Key Figures
| Metric | Value | Sector ⓘ |
|---|---|---|
| Date | Nov 21, 2026 | |
| Context | ||
| Sector | Financial Services | |
| Industry | Credit Services | |
| Market Cap ⓘ | $18.31B | |
| Beta ⓘ | 2.24 | |
Value (Cheapness) | ||
| P/E Ratio ⓘ | 25.65 | 12.01 |
| P/B Ratio ⓘ | 1.63 | 1.48 |
| FCF Yield ⓘ | -44.28% | 8.77% |
| Dividend Yield ⓘ | N/A | 3.01% |
| EBIT / EV ⓘ | 3.82% | 8.31% |
| PEG ⓘ | 0.44 | |
Growth (Business expansion) | ||
| Revenue Growth ⓘ | 43.90% | 6.70% |
| RPS Growth (5Y CAGR) ⓘ | 16.55% | 12.35% |
| EPS Growth (5Y CAGR) ⓘ | N/A | -0.27% |
| BVPS Growth (5Y CAGR) ⓘ | -1.55% | 4.83% |
| Margin Growth (5Y Trend) ⓘ | N/A | -4.16% |
| FCF Growth (5Y CAGR) ⓘ | N/A | 4.69% |
| DPS Growth (5Y CAGR) ⓘ | N/A | 8.82% |
Quality (Business durability) | ||
| ROIC (Latest) ⓘ | 5.01% | 9.49% |
| ROE (Latest) ⓘ | 6.77% | 14.02% |
| ROA (Latest) ⓘ | 1.25% | 1.53% |
| ROIC (5Y Median) ⓘ | -2.21% | 7.80% |
| ROE (5Y Median) ⓘ | -5.43% | 12.09% |
| ROA (5Y Median) ⓘ | -1.23% | 1.28% |
| Net Debt / EBIT (Latest) ⓘ | 0.38 | 0.88 |
| Net Debt / EBIT (5Y Median) ⓘ | N/A | 0.73 |
| Net Debt / EBITDA (Latest) ⓘ | 0.77 | 0.71 |
| Operating Margin (Latest) ⓘ | 13.22% | 23.37% |
| Operating Margin (5Y Median) ⓘ | -14.64% | 24.29% |
| Debt to Equity (Latest) ⓘ | 35.23% | 59.34% |
| Profit Margin (Latest) ⓘ | 15.75% | 26.65% |
| Free Cash Flow (Latest) ⓘ | -$8.11B | |
Momentum (Price trend) | ||
| 3Y Return ⓘ | +88.66% | +73.29% |
| 12M Return (excl. last month) ⓘ | -48.17% | +18.35% |
| 6M Return ⓘ | -20.26% | +3.24% |
| Price vs. 200-Day MA ⓘ | -27.17% | +2.17% |
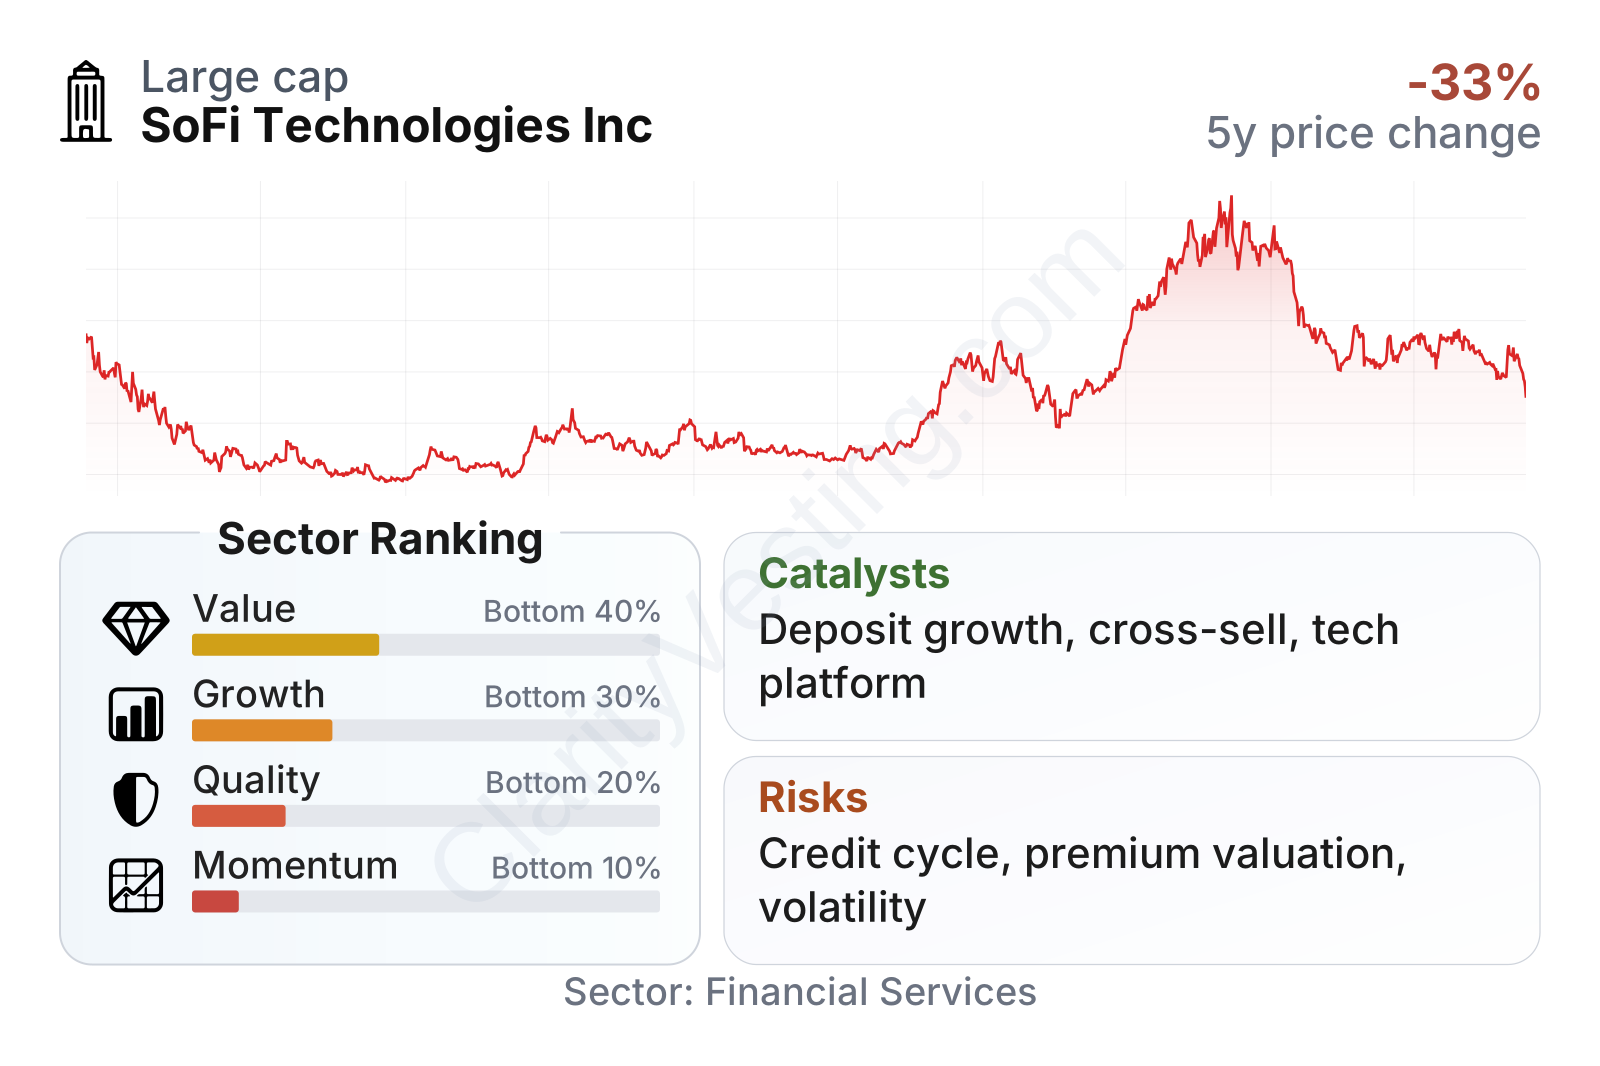
SoFi is now a large-cap financial technology company, but the share price history shows how volatile the market’s expectations have been. After falling sharply from its 2021 highs, the stock later rebounded strongly before another pullback in 2026. That pattern fits a business that is still being valued largely on future potential rather than on mature, steady-state earnings.
The overall metrics profile is mixed. Growth remains clearly stronger than the sector median, especially on recent revenue expansion, but value, quality, and momentum rank lower relative to other financial stocks. The company trades at noticeably higher earnings and book multiples than the sector median, while profitability ratios still lag more established financial firms. In simple terms, the market is paying more for SoFi because it expects above-average expansion, but the company has not yet reached the profitability efficiency usually seen in stronger financial-sector operators.
Growth
SoFi operates in parts of finance that still have room to grow: digital banking, online lending, embedded financial infrastructure, and app-based investing. These areas benefit from long-term consumer behavior changes, especially the shift away from branch-centered banking toward mobile-first financial management. That backdrop is favorable because SoFi is positioned where many younger customers increasingly prefer to interact with financial services.
Its strategy also makes industrial sense. SoFi is trying to lower funding costs through deposits gathered in its bank, use those funds to support lending economics, and then cross-sell higher-engagement products to the same members. At the same time, its technology segment gives it exposure to business customers, which can add a less credit-sensitive source of revenue. This combination is one of the company’s more appealing structural features: consumer finance on one side, financial infrastructure on the other.
Recent earnings progression supports the idea that the model is maturing.
Earnings per share moved from deeply negative levels in 2021 to positive territory in 2024 and strengthened further through 2025 and into 2026. That shift is important because it shows growth is no longer coming only from scale and customer acquisition; it is also beginning to show up in bottom-line results.
Book value per share weakened after 2021, then recovered strongly by 2025. That rebound suggests the balance sheet is improving alongside profitability, even if the longer five-year growth rate for book value still looks soft. For a financial company, this metric matters because durable value creation usually requires both earnings growth and capital base expansion over time.
A meaningful catalyst is the company’s ability to keep converting members into multi-product users. That can improve retention, reduce customer acquisition pressure on a per-product basis, and gradually make revenue more diversified. Another catalyst is the technology platform: if client activity and new platform adoption accelerate, that segment could become more valuable because it is less tied to interest rates and consumer credit cycles than lending. The company’s bank charter also remains strategically important, as it supports deposit gathering and can provide a cheaper funding base than relying more heavily on external financing.
Recent company reporting has also highlighted continuing growth in members, product adoption, and adjusted revenue trends, while management has emphasized its goal of balancing expansion with improved profitability. The key opportunity is that SoFi still has room to grow into its broader “one-stop financial app” ambition if cross-selling and platform monetization continue to improve.
Risks
This article is for informational purposes only and does not constitute financial advice. Some content is AI-generated. See Disclaimer