Stock Analysis · Suncorp Group Ltd (SNMCY)
Overview
Suncorp Group Ltd is an Australian financial services company focused mainly on general insurance. In practical terms, it collects premiums from households and businesses, invests part of that float, and pays claims when covered events happen. Its best-known activities are home, motor, and commercial insurance sold under several brands. The group previously had a banking business, but that operation was sold, leaving Suncorp more concentrated on insurance and related capital management.
For long-term analysis, the most important point is that Suncorp is now much simpler than it used to be. The business is largely tied to property and casualty insurance in Australia and New Zealand, which makes results easier to follow but also increases exposure to weather losses, claims inflation, and pricing cycles.
Based on recent annual reporting, revenue is primarily generated from insurance operations and investment income attached to insurance funds. A simple breakdown is:
- Insurance premiums and related insurance revenue: about 90% to 95% — this includes personal insurance such as motor and home, as well as commercial insurance for businesses.
- Investment income and other insurance-related income: about 5% to 10% — this comes from investing insurance reserves and other balance-sheet funds.
- Banking revenue: 0% in the current structure after the completed bank sale.
Within insurance, the largest earnings base comes from Australia, with a smaller but meaningful contribution from New Zealand. Brand diversity is useful because it allows the group to serve different customer segments without relying on a single label.
The recent financial flow also shows a business that still converts a large revenue base into meaningful profit, but with visible swings from year to year. Revenue has trended upward over the last few fiscal years, while net income has been more uneven, reflecting how insurance pricing gains can be offset by claim costs and catastrophe events.
Key Figures
| Metric | Value | Sector ⓘ |
|---|---|---|
| Date | Oct 10, 2026 | |
| Context | ||
| Sector | Financial Services | |
| Industry | Insurance - Property & Casualty | |
| Market Cap ⓘ | $13.78B | |
| Beta ⓘ | 0.18 | |
Value (Cheapness) | ||
| P/E Ratio ⓘ | 20.31 | 12.38 |
| P/B Ratio ⓘ | 1.47 | 1.23 |
| FCF Yield ⓘ | 31.36% | 10.23% |
| Dividend Yield ⓘ | 4.29% | 3.01% |
| EBIT / EV ⓘ | N/A | 8.08% |
| PEG ⓘ | N/A | |
Growth (Business expansion) | ||
| Revenue Growth ⓘ | -0.50% | 9.50% |
| RPS Growth (5Y CAGR) ⓘ | 9.21% | 12.21% |
| EPS Growth (5Y CAGR) ⓘ | 15.15% | -9.62% |
| BVPS Growth (5Y CAGR) ⓘ | -0.41% | 4.98% |
| Margin Growth (5Y Trend) ⓘ | 13.71% | -4.07% |
| FCF Growth (5Y CAGR) ⓘ | -11.13% | 4.76% |
| DPS Growth (5Y CAGR) ⓘ | -1.57% | 8.79% |
Quality (Business durability) | ||
| ROIC (Latest) ⓘ | N/A | 9.35% |
| ROE (Latest) ⓘ | 23.04% | 13.91% |
| ROA (Latest) ⓘ | 9.08% | 1.53% |
| ROIC (5Y Median) ⓘ | 8.10% | 7.86% |
| ROE (5Y Median) ⓘ | 8.84% | 12.22% |
| ROA (5Y Median) ⓘ | 1.06% | 1.29% |
| Net Debt / EBIT (Latest) ⓘ | N/A | 0.99 |
| Net Debt / EBIT (5Y Median) ⓘ | 1.28 | 0.73 |
| Net Debt / EBITDA (Latest) ⓘ | 0.61 | 0.93 |
| Operating Margin (Latest) ⓘ | N/A | 22.19% |
| Operating Margin (5Y Median) ⓘ | 12.87% | 24.30% |
| Debt to Equity (Latest) ⓘ | 31.20% | 60.24% |
| Profit Margin (Latest) ⓘ | 6.83% | 26.49% |
| Free Cash Flow (Latest) ⓘ | $4.32B | |
Momentum (Price trend) | ||
| 3Y Return ⓘ | +79.55% | +88.52% |
| 12M Return (excl. last month) ⓘ | +5.17% | +19.65% |
| 6M Return ⓘ | +22.56% | +6.00% |
| Price vs. 200-Day MA ⓘ | +10.69% | +3.61% |
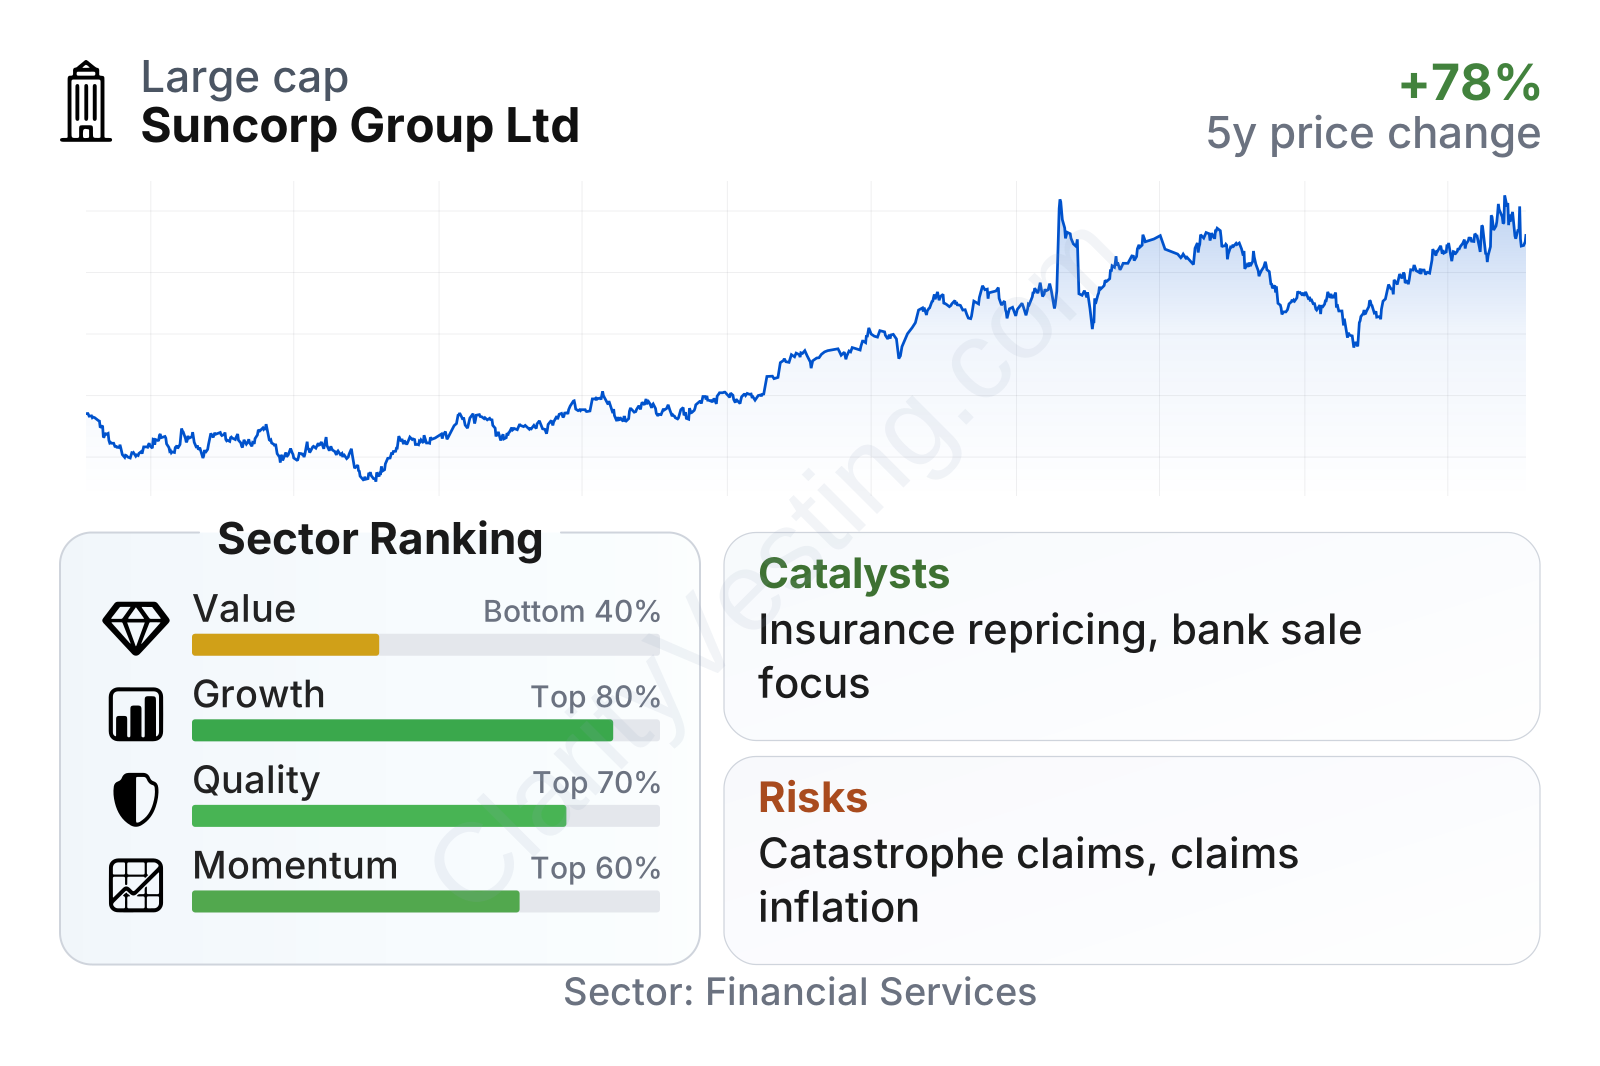
Suncorp looks like a large, established insurer with unusually low share-price volatility for a financial stock, reflected in a beta around 0.2. The quality profile stands out more than the valuation profile: returns on equity and assets are ahead of sector medians, leverage is moderate, and free cash flow is very strong. By contrast, the value factor ranks weaker because the shares trade at a higher earnings multiple than the sector median and somewhat above the sector median on price-to-book as well. Growth is mixed: earnings growth over five years has been strong, but recent revenue growth has been flat and book value growth has been soft. Price momentum is respectable over the last six months, though weaker over the prior year than much of the sector.
Growth
General insurance is not a high-growth industry in the way software or semiconductors can be, but it is a durable one. Demand is recurring because people must insure homes, vehicles, and businesses regardless of the economic cycle. In addition, inflation and higher repair and rebuilding costs usually lead to higher insured values and, over time, higher premiums. That creates a natural path for nominal growth if underwriting discipline is maintained.
Suncorp’s strategy makes sense for this environment. The sale of the banking business has sharpened the company’s focus on insurance, simplified the balance sheet, and increased flexibility around capital returns and reinvestment. A cleaner structure can help management concentrate on pricing, claims control, digital distribution, and reinsurance management rather than splitting attention across unrelated activities.
The earnings trend has been favorable over a multi-year period even if annual results remain lumpy. Five-year EPS growth has clearly outpaced the sector median, showing that profitability improved meaningfully through the insurance cycle. That said, this progress has not translated into steady book value expansion, which is an important reminder that capital returns, reserve movements, and catastrophe volatility can limit balance-sheet compounding.
A current catalyst is the company’s ability to keep repricing policies after several years of elevated claims inflation. If premium increases continue to stay ahead of claims cost growth, margins can remain healthy. Another support is investment income: insurers typically benefit when they can reinvest reserves at higher yields. Suncorp also remains exposed to ongoing insurance affordability and risk-management trends in Australia, where rising weather risk increases the need for coverage, even if it also makes underwriting harder.
Recent corporate developments also matter. With the bank divestment completed and proceeds already reshaping the group, Suncorp now has more room to emphasize insurance execution and capital management. For a long-term view, that is one of the clearest changes in the investment case: the company has become a more focused insurer rather than a mixed financial conglomerate.
Risks
This article is for informational purposes only and does not constitute financial advice. Some content is AI-generated. See Disclaimer