Stock Analysis · Stonex Group Inc (SNEX)
Overview
StoneX Group Inc is a financial services company that helps businesses, institutions, and professional traders move money, manage risk, trade across markets, and finance physical commodities. In simple terms, it acts as a global marketplace intermediary. A grain elevator can use StoneX to hedge crop prices, an institutional client can clear futures trades through it, a commercial business can exchange currencies, and wealth clients can access trading and investment services through its platforms.
The business is broad, but it is largely built around execution, clearing, financing, and risk management rather than traditional consumer banking. StoneX operates in more than one region and connects clients to futures, securities, foreign exchange, commodities, and payments infrastructure. That makes it less dependent on one single market niche, although its results can still swing with trading activity, interest rates, and client balances.
Based on recent annual disclosures, revenue is heavily shaped by transactional and financing activity tied to client trading and commodity flows. Because StoneX reports some businesses on a gross basis, the revenue mix can look unusually large relative to profits, so net income and margins matter more than top-line revenue alone. The main economic sources of revenue appear to come from the following areas:
- Physical commodities and related commercial activity: approximately 80% to 90% of total revenue in recent years. This includes commodity merchandising, inventory-related activity, and physical trading flows, especially in agricultural and energy-linked markets.
- Interest income: approximately 5% to 10%. This comes from financing client positions, securities lending and borrowing, and earning spreads on client cash and other balances.
- Commissions and clearing/execution fees: approximately 2% to 6%. This includes futures and options brokerage, exchange-traded execution, listed derivatives clearing, and securities-related transaction fees.
- Principal gains, spreads, and other trading-related income: generally a small-to-mid single-digit percentage of revenue when measured on the reported top line. This includes market-making, over-the-counter products, and foreign exchange execution economics.
What stands out is that StoneX turns very large transaction volumes into relatively thin margins, which is common in parts of brokerage, clearing, and physical commodities intermediation. The company’s value is less about high markups and more about scale, infrastructure, risk management, and client connectivity across many markets.
The long-term pattern shows rapid expansion in reported revenue, gross profit, and operating income, even though interest expense has also climbed as the balance sheet and funding needs grew. Net income has advanced much more slowly than revenue, which reinforces the idea that this is a scale-driven, low-margin business.
Key Figures
| Metric | Value | Sector ⓘ |
|---|---|---|
| Date | Oct 17, 2026 | |
| Context | ||
| Sector | Financial Services | |
| Industry | Capital Markets | |
| Market Cap ⓘ | $7.23B | |
| Beta ⓘ | 0.62 | |
Value (Cheapness) | ||
| P/E Ratio ⓘ | 19.91 | 12.26 |
| P/B Ratio ⓘ | 2.62 | 1.23 |
| FCF Yield ⓘ | 70.14% | 10.40% |
| Dividend Yield ⓘ | N/A | 3.02% |
| EBIT / EV ⓘ | 9.03% | 8.14% |
| PEG ⓘ | N/A | |
Growth (Business expansion) | ||
| Revenue Growth ⓘ | 15.20% | 9.35% |
| RPS Growth (5Y CAGR) ⓘ | 5.14% | 12.19% |
| EPS Growth (5Y CAGR) ⓘ | 15.86% | -9.53% |
| BVPS Growth (5Y CAGR) ⓘ | 1.45% | 4.99% |
| Margin Growth (5Y Trend) ⓘ | 0.85% | -3.86% |
| FCF Growth (5Y CAGR) ⓘ | 20.35% | 4.81% |
| DPS Growth (5Y CAGR) ⓘ | -13.52% | 8.79% |
Quality (Business durability) | ||
| ROIC (Latest) ⓘ | 8.76% | 9.49% |
| ROE (Latest) ⓘ | 20.18% | 13.90% |
| ROA (Latest) ⓘ | 1.06% | 1.55% |
| ROIC (5Y Median) ⓘ | 8.44% | 7.86% |
| ROE (5Y Median) ⓘ | 16.89% | 12.17% |
| ROA (5Y Median) ⓘ | 1.14% | 1.30% |
| Net Debt / EBIT (Latest) ⓘ | 6.78 | 0.96 |
| Net Debt / EBIT (5Y Median) ⓘ | 6.53 | 0.73 |
| Net Debt / EBITDA (Latest) ⓘ | 6.45 | 0.92 |
| Operating Margin (Latest) ⓘ | 1.67% | 22.30% |
| Operating Margin (5Y Median) ⓘ | 1.43% | 24.63% |
| Debt to Equity (Latest) ⓘ | 704.77% | 58.56% |
| Profit Margin (Latest) ⓘ | 0.34% | 26.57% |
| Free Cash Flow (Latest) ⓘ | $5.07B | |
Momentum (Price trend) | ||
| 3Y Return ⓘ | +227.94% | +88.33% |
| 12M Return (excl. last month) ⓘ | +59.04% | +19.38% |
| 6M Return ⓘ | -12.14% | +4.75% |
| Price vs. 200-Day MA ⓘ | -8.21% | +3.50% |
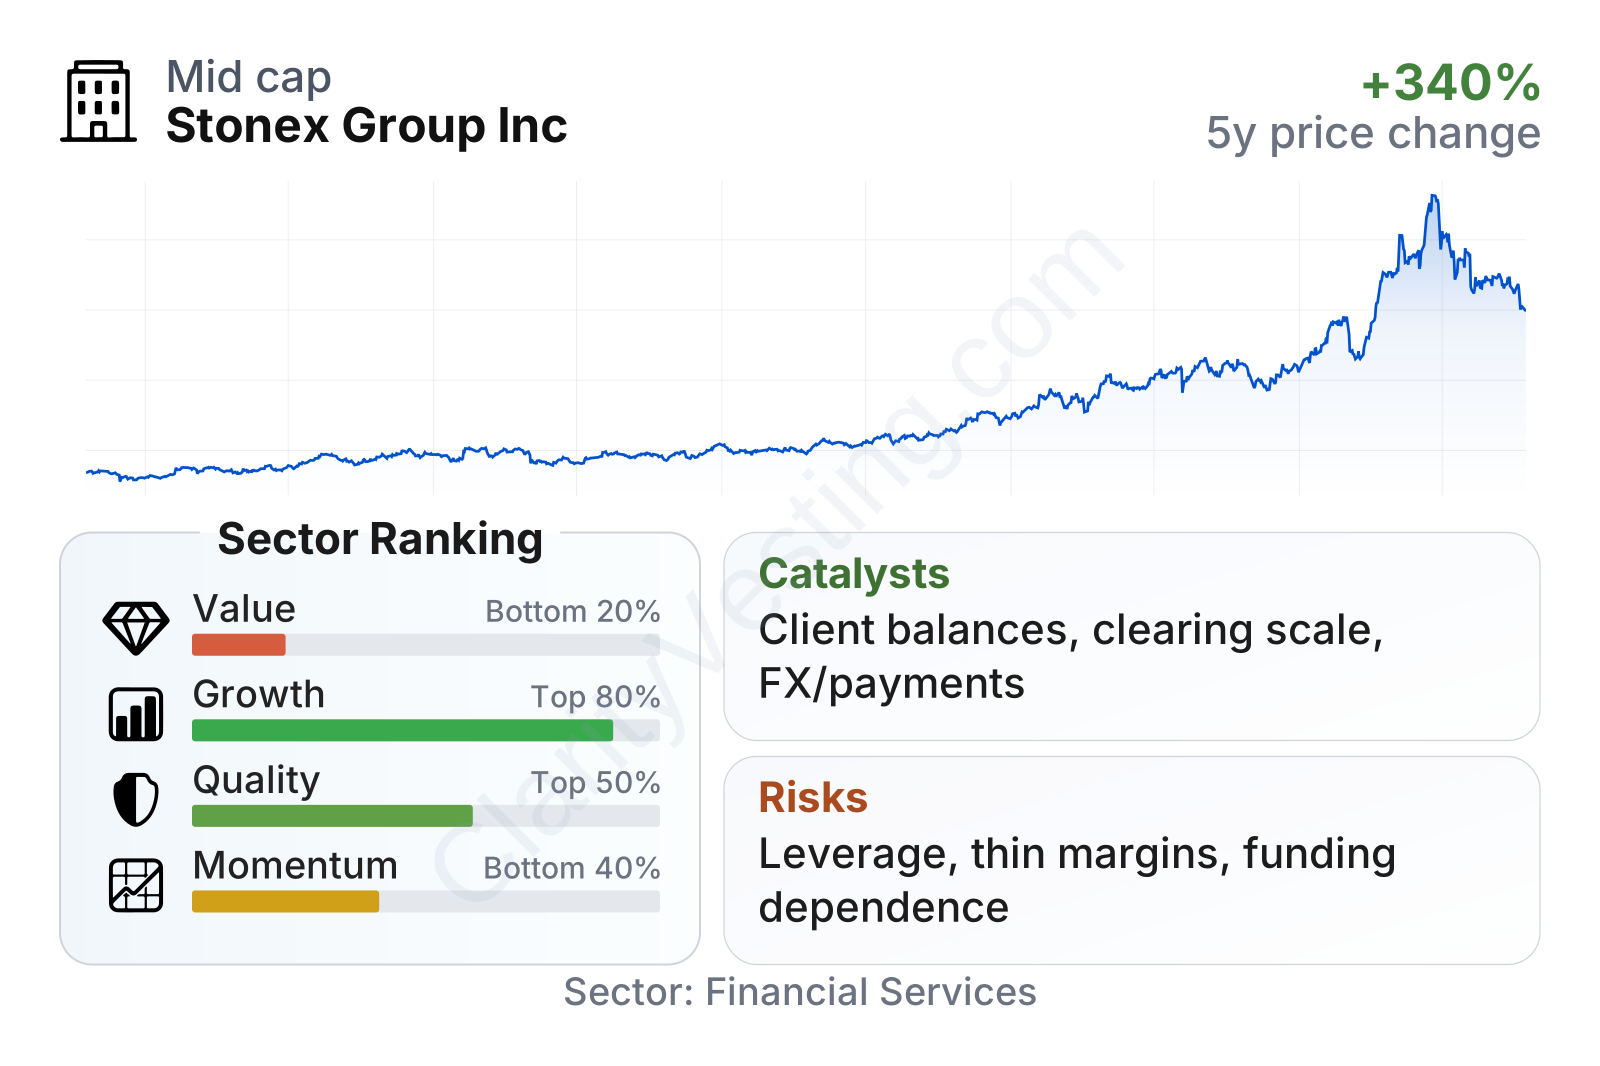
StoneX is now a large financial services company by market value, and the share price has risen sharply over the last three years, clearly ahead of the sector median. Growth and momentum metrics are strong overall, while quality looks solid but mixed depending on the measure used. Return on equity is notably above the sector median, but return on assets and operating margin are lower, which is typical for a balance-sheet-heavy intermediary with high volumes and slim spreads. On valuation, the stock screens as expensive versus the sector on both earnings and book value multiples, even though cash generation and EBIT-to-enterprise-value metrics remain supportive.
Growth
StoneX operates in markets that benefit from several durable trends: more electronic trading, rising demand for risk management, increasing complexity in cross-border payments, and greater need for access to global commodity, currency, and capital markets. Those trends are not new, but they remain relevant because more businesses now need hedging, liquidity access, and financing support in volatile environments.
The company’s strategy also has a clear logic. Instead of relying on one profit engine, StoneX keeps widening the client workflow it can serve: execution, clearing, custody, financing, foreign exchange, and physical commodity services. That can deepen relationships and increase revenue per client over time. It also gives the company room to benefit when volatility rises, because clients often trade more, hedge more, and hold larger balances during uncertain periods.
Earnings per share have improved over the past five years, with a particularly strong step-up in fiscal 2025. The latest trailing figure remains close to that higher level, suggesting that the recent improvement was not merely a one-quarter spike. The broader growth profile is also supported by above-sector revenue growth and a strong five-year EPS compound growth rate.
Book value per share has recovered and expanded meaningfully since the post-2021 reset, which matters for a financial company because book value often reflects the cumulative strength of capital generation. The pace is not exceptional relative to the sector median, but the direction has been positive and consistent in recent years.
A meaningful catalyst is the company’s ability to keep compounding client assets, balances, and transaction activity across multiple product lines at once. Another is interest-sensitive income: when client cash, secured financing balances, and lending-related activity remain elevated, earnings can receive support beyond simple commission growth. The company has also continued to emphasize global reach and commercial market penetration, which could expand its role with institutional and corporate customers that need one counterparty across several asset classes and geographies.
Recent company communications have continued to highlight record or near-record operating performance, expanding client engagement, and strength in commercial, institutional, and self-directed channels. That does not guarantee the same pace ahead, but it supports the idea that current momentum has been driven by more than one temporary factor.
Risks
This article is for informational purposes only and does not constitute financial advice. Some content is AI-generated. See Disclaimer


