Stock Analysis · PT Sarana Menara Nusantara Tbk (SMNUF)
Overview
PT Sarana Menara Nusantara Tbk is an Indonesian digital infrastructure company best known through its tower business. Although some market databases place it in real estate services, the business is more usefully understood as a telecom infrastructure owner and operator. It leases space on telecom towers to mobile network operators, provides supporting infrastructure such as shelters and power systems, and has expanded into fiber connectivity. Its operating model is relatively simple: build or acquire infrastructure, sign multi-year contracts with telecom customers, and collect recurring rental and service income.
The group’s revenue is primarily generated in Indonesia, where mobile data use continues to rise and network coverage remains important across a large archipelago. Public company materials indicate that towers remain the core profit engine, while fiber and related services are a smaller but growing part of the platform.
Main revenue sources are approximately:
- Tower leasing and colocation: about 85% to 90%. This includes recurring rent from telecom operators that place equipment on the company’s tower sites.
- Fiber network and connectivity services: about 10% to 15%. This covers fiber backhaul and related telecom infrastructure services, mainly through the group’s broader digital infrastructure platform.
- Other services: a small residual share. This can include site-related services, energy support, and ancillary infrastructure activities.
This mix matters because tower leasing tends to be contract-based, sticky, and cash generative. Over time, adding more tenants to existing sites can improve returns without requiring proportional new spending.
The profit structure points to a business with strong gross profitability and high operating margins, which is typical for established tower portfolios. Revenue has risen steadily over the past several years, while financing costs have remained meaningful, showing that the business model is attractive but still shaped by debt funding.
Key Figures
| Metric | Value | Sector ⓘ |
|---|---|---|
| Date | Nov 21, 2026 | |
| Context | ||
| Sector | Real Estate | |
| Industry | Real Estate Services | |
| Market Cap ⓘ | $1.81B | |
| Beta ⓘ | 0.02 | |
Value (Cheapness) | ||
| P/E Ratio ⓘ | N/A | 17.59 |
| P/B Ratio ⓘ | N/A | 1.58 |
| FCF Yield ⓘ | 8.92% | 5.76% |
| Dividend Yield ⓘ | N/A | 4.81% |
| EBIT / EV ⓘ | 11.39% | 4.97% |
| PEG ⓘ | N/A | |
Growth (Business expansion) | ||
| Revenue Growth ⓘ | 17.10% | 5.70% |
| RPS Growth (5Y CAGR) ⓘ | 9.54% | 5.96% |
| EPS Growth (5Y CAGR) ⓘ | -93.27% | -3.46% |
| BVPS Growth (5Y CAGR) ⓘ | 20.13% | 0.32% |
| Margin Growth (5Y Trend) ⓘ | -4.35% | -0.65% |
| FCF Growth (5Y CAGR) ⓘ | N/A | 5.08% |
| DPS Growth (5Y CAGR) ⓘ | -5.67% | 5.00% |
Quality (Business durability) | ||
| ROIC (Latest) ⓘ | 9.20% | 5.13% |
| ROE (Latest) ⓘ | 13.98% | 7.64% |
| ROA (Latest) ⓘ | 4.82% | 3.05% |
| ROIC (5Y Median) ⓘ | 9.95% | 4.20% |
| ROE (5Y Median) ⓘ | 21.14% | 6.03% |
| ROA (5Y Median) ⓘ | 4.85% | 2.41% |
| Net Debt / EBIT (Latest) ⓘ | 6.14 | 7.59 |
| Net Debt / EBIT (5Y Median) ⓘ | 7.45 | 8.34 |
| Net Debt / EBITDA (Latest) ⓘ | 4.81 | 5.43 |
| Net Debt / Assets ⓘ | 54.20% | 38.21% |
| EBITDA / Interest ⓘ | 3.47 | 4.20 |
| Operating Margin (Latest) ⓘ | 50.57% | 34.59% |
| Operating Margin (5Y Median) ⓘ | 53.88% | 37.64% |
| Debt to Equity (Latest) ⓘ | 157.44% | 90.32% |
| Profit Margin (Latest) ⓘ | 26.51% | 20.10% |
| Free Cash Flow (Latest) ⓘ | $161.56M | |
Momentum (Price trend) | ||
| 3Y Return ⓘ | -43.53% | +27.88% |
| 12M Return (excl. last month) ⓘ | -13.86% | +1.16% |
| 6M Return ⓘ | +28.10% | -3.06% |
| Price vs. 200-Day MA ⓘ | -41.97% | -0.73% |
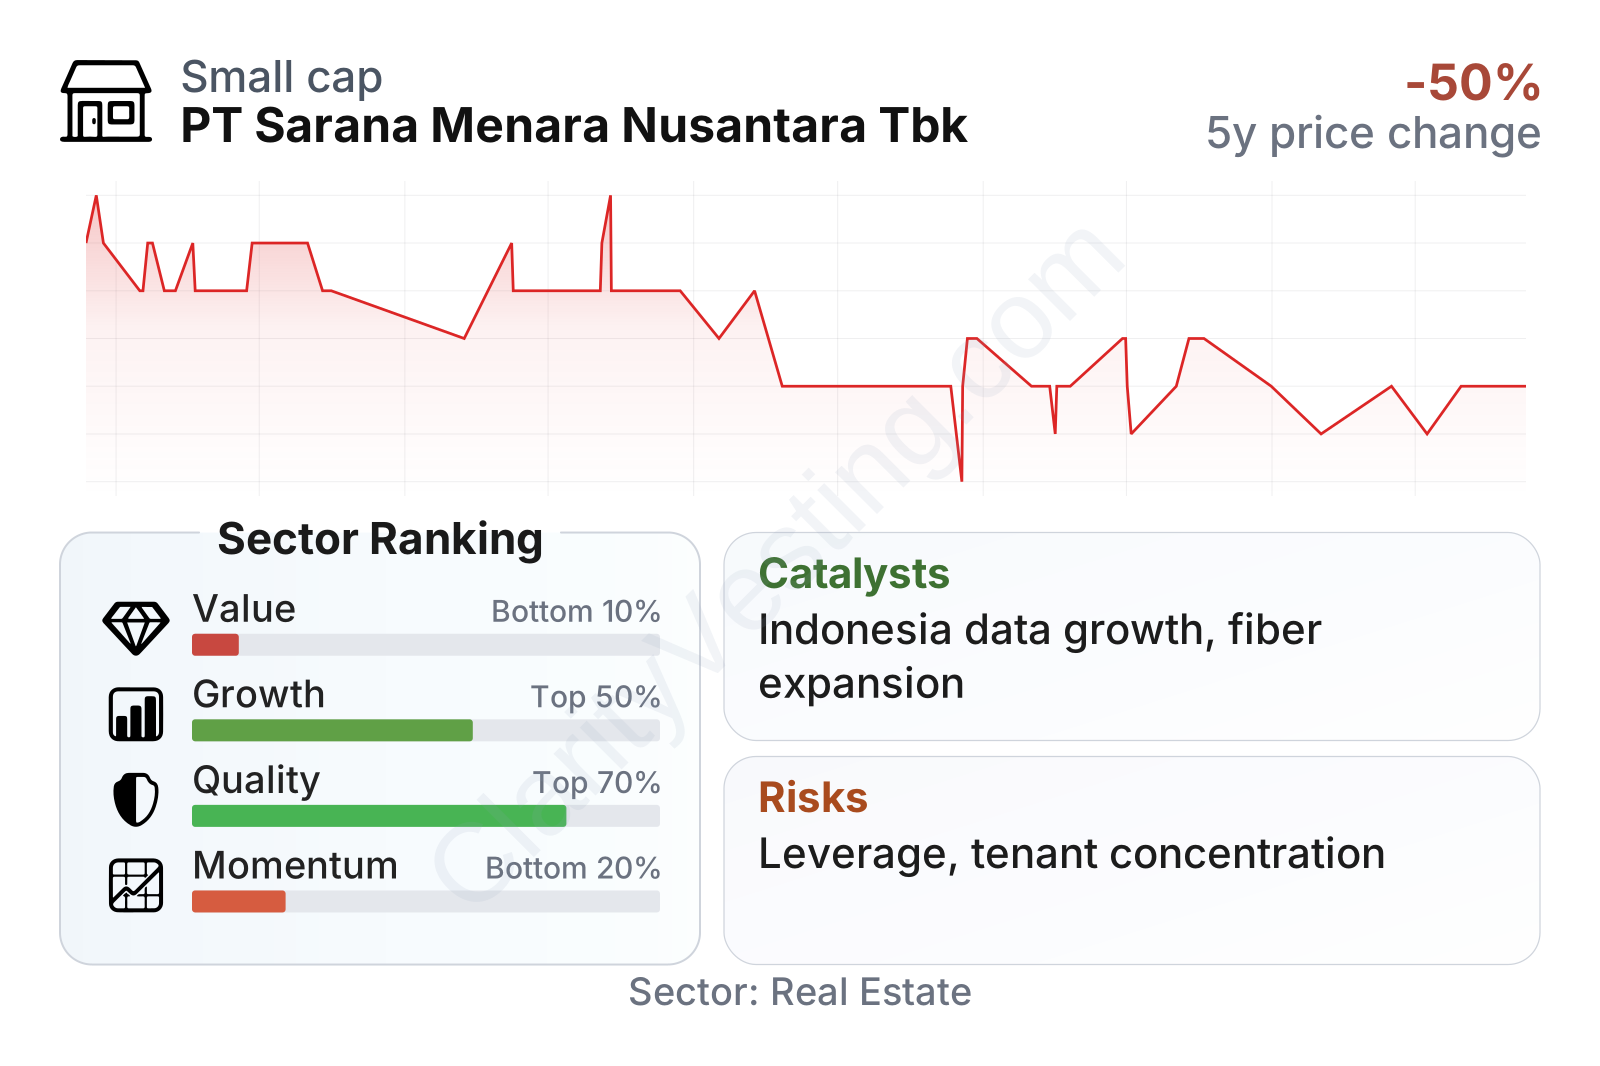
The company stands out for profitability and cash generation more than for traditional headline valuation ratios. Free cash flow yield and EBIT relative to enterprise value look stronger than the sector median, while returns on capital, equity, and assets are also above typical peers. Growth is mixed: recent revenue expansion has been healthy, but earnings per share over a multi-year period have been distorted by financing costs and other below-operating-line pressures. Market performance has been weak over three years, even though short-term trading has improved somewhat, suggesting the stock’s re-rating has not kept pace with the operating business.
Another notable point is stability. The stock’s beta is extremely low, which usually means price moves have shown limited correlation with broader market swings. That does not remove business risk, but it does suggest a different trading profile from many cyclical property names.
Growth
Sarana Menara Nusantara operates in a sector with durable long-term demand drivers. Mobile data usage in Indonesia keeps expanding, telecom operators still need broad and reliable coverage, and digital infrastructure remains essential for both consumer and enterprise connectivity. Even when tenant consolidation slows new tower additions, existing sites can still benefit from tenancy upgrades, equipment additions, and broader network densification.
The company’s strategy is logical for this backdrop. Tower assets create recurring rent, while fiber broadens the platform into adjacent infrastructure needed for data transport. That combination can deepen customer relationships and make the group more relevant as operators shift spending toward integrated network solutions rather than isolated tower leasing.
Revenue per share has generally moved upward over the last five years, with only a modest pullback at the end of the period. That pattern supports the view that the business has continued to expand on a per-share basis instead of relying purely on financial engineering.
The dividend record has been less consistent. Payouts declined from earlier levels and then partially recovered, which fits a company balancing shareholder returns with leverage management and infrastructure investment. For long-horizon analysis, that makes operating cash generation more important than the current cash yield.
A visible catalyst is the continuing need for Indonesian telecom infrastructure. Large operators require tower access, backhaul capacity, and network quality improvements to support rising data traffic. If tower tenancy increases or fiber utilization improves, incremental economics can be attractive because much of the site cost base is already in place. The company’s established footprint and scale also make it relevant when operators seek nationwide infrastructure partners rather than smaller local providers.
Risks
This article is for informational purposes only and does not constitute financial advice. Some content is AI-generated. See Disclaimer