Stock Analysis · SM Energy Co (SM)
Overview
SM Energy Co is an independent oil and gas exploration and production company. In simple terms, it drills wells, produces crude oil, natural gas, and natural gas liquids, and then sells those commodities into the market. Its operations are concentrated in two major U.S. basins: the Midland Basin in West Texas, which is part of the Permian, and the South Texas region, primarily in the Eagle Ford.
That business model makes SM Energy a relatively straightforward company to understand. It does not run large refineries or gas stations. Its results depend mainly on how much oil and gas it can produce, what prices it receives, and how efficiently it can develop its acreage.
Based on recent company disclosures, revenue is overwhelmingly tied to hydrocarbon sales, with oil remaining the main driver. A practical way to think about the mix is:
- Oil sales: approximately 70% to 80% of total product revenue. This is the company’s largest source and usually carries the strongest margins.
- Natural gas liquids sales: approximately 10% to 20%. This includes products such as propane and butane separated during processing.
- Natural gas sales: approximately 10% to 15%. This is the smallest of the three major streams and tends to have more pricing pressure than oil.
Geographically, the business is also concentrated. The Midland Basin has become the largest engine of growth after recent portfolio expansion, while South Texas remains an important cash-generating area. That narrow focus can be a strength because management can direct capital toward its best acreage, but it also means performance is tied to a limited set of regions.
The multi-year financial flow shows a business that benefited strongly from the 2022 commodity upcycle, remained profitable afterward, and then saw costs and interest expense rise as it expanded. Revenue recovered meaningfully into 2025, but free cash generation became less steady as capital needs increased.
Key Figures
| Metric | Value | Sector ⓘ |
|---|---|---|
| Date | Oct 17, 2026 | |
| Context | ||
| Sector | Energy | |
| Industry | Oil & Gas E&P | |
| Market Cap ⓘ | $9.17B | |
| Beta ⓘ | 0.96 | |
Value (Cheapness) | ||
| P/E Ratio ⓘ | 6.68 | 15.44 |
| P/B Ratio ⓘ | 1.17 | 1.73 |
| FCF Yield ⓘ | -0.41% | 8.20% |
| Dividend Yield ⓘ | 2.18% | 3.59% |
| EBIT / EV ⓘ | 34.72% | 7.46% |
| PEG ⓘ | 0.16 | |
Growth (Business expansion) | ||
| Revenue Growth ⓘ | 176.10% | 26.90% |
| RPS Growth (5Y CAGR) ⓘ | 6.90% | 6.90% |
| EPS Growth (5Y CAGR) ⓘ | -16.28% | -15.73% |
| BVPS Growth (5Y CAGR) ⓘ | 25.84% | 6.07% |
| Margin Growth (5Y Trend) ⓘ | 23.85% | 0.58% |
| FCF Growth (5Y CAGR) ⓘ | 4.44% | 1.86% |
| DPS Growth (5Y CAGR) ⓘ | 153.58% | 16.79% |
Quality (Business durability) | ||
| ROIC (Latest) ⓘ | 13.04% | 11.40% |
| ROA (Latest) ⓘ | 7.16% | 6.06% |
| ROIC (5Y Median) ⓘ | 14.46% | 10.30% |
| ROA (5Y Median) ⓘ | 10.30% | 5.42% |
| Net Debt / EBIT (Latest) ⓘ | 3.39 | 1.64 |
| Net Debt / EBIT (5Y Median) ⓘ | 2.48 | 1.83 |
| Net Debt / EBITDA (Latest) ⓘ | 1.80 | 1.08 |
| Net Debt / Assets ⓘ | 34.02% | 17.29% |
| EBITDA / Interest ⓘ | 6.25 | 9.64 |
| Operating Margin (Latest) ⓘ | 34.39% | 16.27% |
| Operating Margin (5Y Median) ⓘ | 41.44% | 20.39% |
| Debt to Equity (Latest) ⓘ | 90.06% | 54.76% |
| Profit Margin (Latest) ⓘ | 20.15% | 8.82% |
| Free Cash Flow (Latest) ⓘ | -$37.54M | |
Momentum (Price trend) | ||
| 3Y Return ⓘ | -1.06% | +67.38% |
| 12M Return (excl. last month) ⓘ | +52.08% | +49.19% |
| 6M Return ⓘ | +40.00% | +7.07% |
| Price vs. 200-Day MA ⓘ | +32.69% | +9.56% |
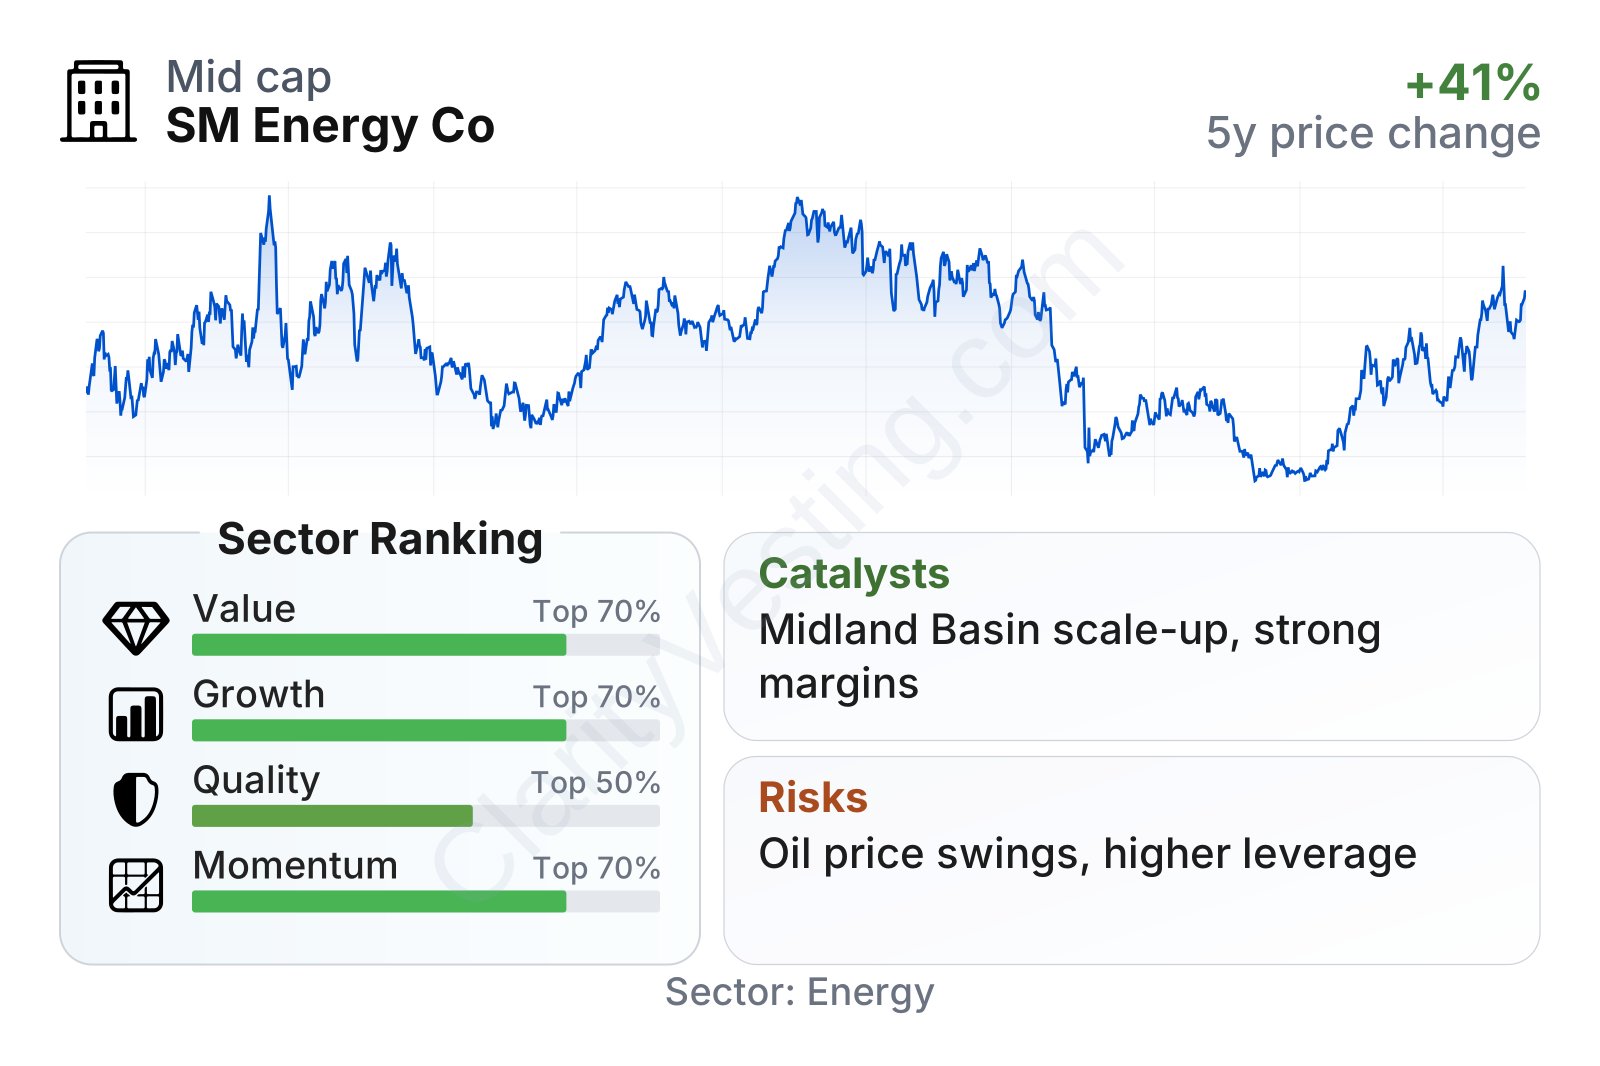
SM Energy is a mid-sized exploration and production company with a market value around the upper single-digit billions of dollars. The most striking feature in the current metrics is the combination of low headline valuation multiples and solid profitability. Earnings and book value multiples sit below sector medians, while returns on capital and margins remain better than many peers. At the same time, balance-sheet leverage is heavier than the sector norm, and recent free cash flow has turned negative, which limits how cleanly the low valuation can be interpreted.
The stock price history also shows why the company can look cheap at times. Shares have been highly cyclical, climbing sharply during strong oil markets and then dropping just as quickly when energy prices or growth expectations weaken. More recently, momentum has improved from earlier lows, but the longer-term path still reflects the volatility typical of upstream producers.
Growth
SM Energy operates in a sector that still has long-term demand, but it is not a classic secular growth industry like software or semiconductors. Oil and gas demand remains large because transportation, petrochemicals, power, and industrial activity still rely heavily on hydrocarbons. For a company like SM Energy, growth is less about the whole sector expanding rapidly and more about owning attractive acreage, drilling efficiently, and increasing production per well.
The company’s strategy appears coherent in that context. Management has focused on high-return U.S. shale positions, especially in the Permian and Eagle Ford, where infrastructure is established and drilling economics can be competitive. Recent portfolio moves have increased the weight of the Midland Basin, which matters because the Permian remains one of the most productive and lowest-cost oil regions in North America.
Revenue growth has been volatile, which is normal for an upstream oil producer, but the latest period shows a very strong rebound. That surge is far above the sector median and points to a mix of higher volumes, portfolio changes, and commodity-price effects. Over a longer period, per-share revenue growth has been much more moderate, which is a better reminder that this is still a cyclical business rather than a smooth compounding machine.
Cash generation is the more important point to watch. SM Energy has produced strong cash in favorable years, but free cash flow recently turned negative. For a long-term reader, that usually means one of two things: either the company is investing heavily to support future production, or current capital spending and acquisitions are temporarily outrunning operating cash. In SM Energy’s case, the recent pattern suggests expansion has required a meaningful amount of cash upfront.
A notable catalyst is the company’s larger scale in the Midland Basin after its recent transaction activity. If management delivers the expected operational synergies, inventory depth, and production growth from that asset base, SM Energy could emerge with a stronger production mix and a longer runway of drilling locations. Another favorable element is that the company has shown an ability to maintain operating margins well above the industry median, which gives it a buffer if oil prices soften but remain supportive.
Recent company updates have also pointed to continued integration work, development execution, and shareholder return policies through dividends. None of these removes commodity exposure, but they do suggest management is trying to balance growth with returns and operational discipline.
Risks
This article is for informational purposes only and does not constitute financial advice. Some content is AI-generated. See Disclaimer


