Stock Analysis · Sylvamo Corp (SLVM)
Overview
Sylvamo Corp is a paper company focused mainly on uncoated freesheet paper, a grade used for everyday printing, copying, forms, envelopes, and office documents. It also sells pulp and some paper-related products. The company operates manufacturing mills in North America, Latin America, and Europe, and it serves both commercial customers and office-paper distribution channels. Sylvamo was created as a standalone company after being separated from International Paper in 2021.
Its revenue base is concentrated in paper rather than packaging or tissue, which makes the business easier to understand but also more exposed to paper demand and paper pricing cycles. Based on company reporting, the main sources of revenue are approximately:
- North America paper operations: about 40% to 45% of revenue. This includes office paper and printing paper sold across the U.S. and Canada.
- Latin America paper operations: about 30% to 35% of revenue. This business includes paper and pulp, with Brazil playing an important role in the company’s production footprint.
- Europe paper operations: about 20% to 25% of revenue. This segment serves European office and printing markets.
- Other sales: typically a small share, including by-products and intercompany-related items.
Sylvamo’s recent financial path shows how cyclical this business can be. Revenue climbed from roughly $2.8 billion in 2021 to about $3.8 billion in 2024, then fell back to around $3.4 billion in 2025. Profitability followed the same pattern: strong improvement after the spin-off, then a meaningful cooldown as prices and demand softened. That profile is central to understanding the stock for long-term analysis.
The business mix has remained fairly stable, but earnings conversion has not. Revenue stayed above pre-2022 levels, yet operating profit and net income narrowed sharply in 2025, showing that pricing and cost pressure matter more here than headline sales alone.
Key Figures
| Metric | Value | Sector ⓘ |
|---|---|---|
| Date | Oct 17, 2026 | |
| Context | ||
| Sector | Basic Materials | |
| Industry | Paper & Paper Products | |
| Market Cap ⓘ | $1.26B | |
| Beta ⓘ | 0.77 | |
Value (Cheapness) | ||
| P/E Ratio ⓘ | 16.06 | 16.90 |
| P/B Ratio ⓘ | 1.34 | 1.65 |
| FCF Yield ⓘ | 7.87% | 5.76% |
| Dividend Yield ⓘ | 5.60% | 2.13% |
| EBIT / EV ⓘ | 8.05% | 6.30% |
| PEG ⓘ | N/A | |
Growth (Business expansion) | ||
| Revenue Growth ⓘ | 1.50% | 11.10% |
| RPS Growth (5Y CAGR) ⓘ | 6.19% | 4.49% |
| EPS Growth (5Y CAGR) ⓘ | N/A | -13.47% |
| BVPS Growth (5Y CAGR) ⓘ | 54.49% | 5.51% |
| Margin Growth (5Y Trend) ⓘ | -5.41% | -1.54% |
| FCF Growth (5Y CAGR) ⓘ | -44.98% | 0.37% |
| DPS Growth (5Y CAGR) ⓘ | 67.30% | 6.08% |
Quality (Business durability) | ||
| ROIC (Latest) ⓘ | -1.33% | 9.26% |
| ROA (Latest) ⓘ | 2.72% | 4.91% |
| ROIC (5Y Median) ⓘ | 16.48% | 7.70% |
| ROA (5Y Median) ⓘ | 9.06% | 3.86% |
| Net Debt / EBIT (Latest) ⓘ | 4.55 | 1.40 |
| Net Debt / EBIT (5Y Median) ⓘ | 1.72 | 1.70 |
| Net Debt / EBITDA (Latest) ⓘ | 2.32 | 0.95 |
| Net Debt / Assets ⓘ | 29.25% | 13.69% |
| EBITDA / Interest ⓘ | 8.64 | 12.34 |
| Operating Margin (Latest) ⓘ | 5.61% | 13.20% |
| Operating Margin (5Y Median) ⓘ | 12.14% | 11.80% |
| Debt to Equity (Latest) ⓘ | 100.94% | 40.56% |
| Profit Margin (Latest) ⓘ | 2.31% | 6.43% |
| Free Cash Flow (Latest) ⓘ | $99.00M | |
Momentum (Price trend) | ||
| 3Y Return ⓘ | -17.78% | +68.89% |
| 12M Return (excl. last month) ⓘ | -15.11% | +30.21% |
| 6M Return ⓘ | -23.11% | -4.16% |
| Price vs. 200-Day MA ⓘ | -19.86% | -1.27% |
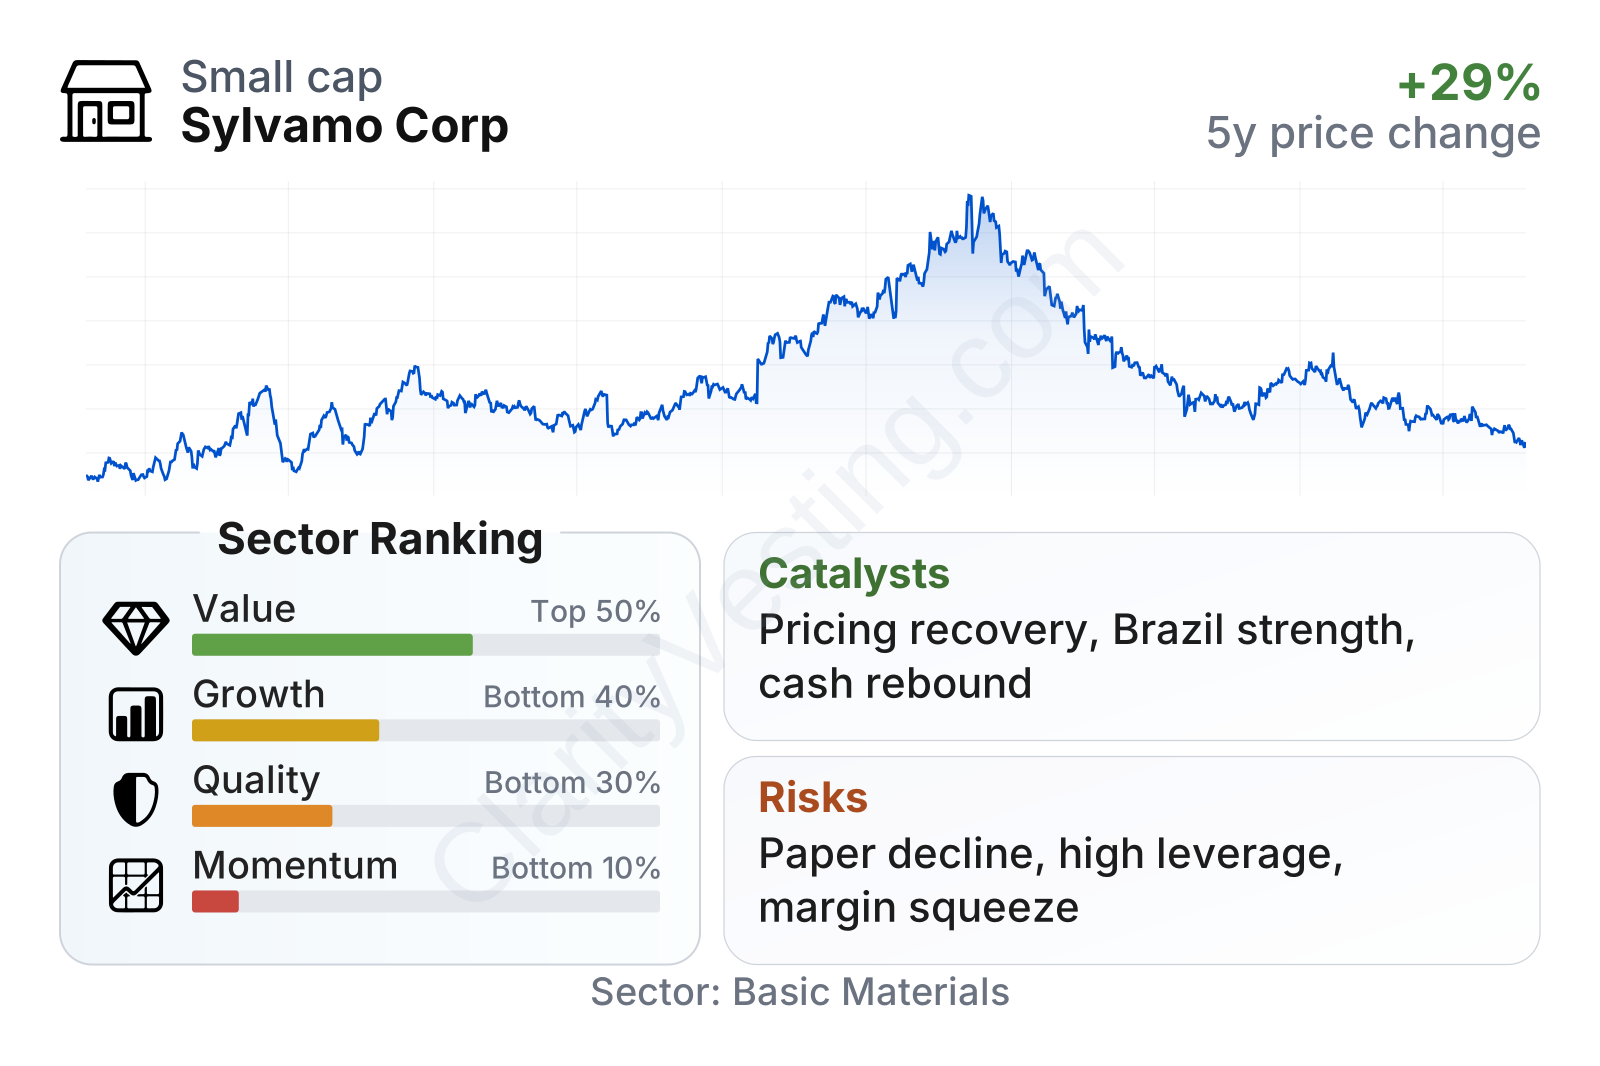
Sylvamo is a mid-sized paper producer with a relatively low beta, which means the stock has historically moved less than the broader market. On valuation metrics, it looks mixed to favorable: the earnings multiple is close to the sector median, while price-to-book is lower and free cash flow yield and dividend yield are stronger than many peers. The weaker areas are growth, recent profitability, and market momentum. Quality metrics are also under pressure because leverage is elevated and trailing returns on capital have deteriorated.
Growth
Sylvamo does not operate in a fast-growing industry. Uncoated freesheet paper is generally a mature market, and in many developed economies structural demand has been pressured for years by digitization. That limits the case for broad volume-led expansion. Long-term progress is therefore more likely to come from cost control, mill optimization, disciplined capacity management, regional positioning, and cash returns rather than from rapid industry growth.
The company’s strategy is still logical within that mature setting. Sylvamo emphasizes low-cost assets, regional manufacturing positions, commercial discipline, and shareholder returns. In Latin America, especially Brazil, it has exposure to markets that can be more resilient than the office-paper markets of North America and Europe. The company has also highlighted operational reliability, debt reduction, and productivity projects as ways to support performance even when volumes are not growing much.
Revenue growth has been uneven. There were periods of very strong gains in 2022, followed by flatter and then negative comparisons through much of 2025, with only a modest rebound recently. That pattern suggests the company is highly influenced by pricing cycles and shipment demand rather than enjoying steady compounding growth.
Cash generation tells a similar story. Free cash flow was much stronger in earlier periods and then weakened sharply into 2026. For a mature paper company, this matters a great deal because free cash flow is one of the clearest signals of how much room the company has for dividends, debt reduction, and mill investment. A recovery here would be an important operating catalyst.
Recent company communications have centered on execution, productivity, and capital allocation rather than transformational expansion. That is consistent with the industry’s realities. The most meaningful upside catalyst is not a new market opening, but a combination of better paper pricing, stable input costs, stronger mill utilization, and improved free cash flow after a weak stretch.
Risks
This article is for informational purposes only and does not constitute financial advice. Some content is AI-generated. See Disclaimer


