Stock Analysis · Sellas Life Sciences Group Inc (SLS)
Overview
Sellas Life Sciences Group is a small biotechnology company focused on cancer treatments. Its business is centered on developing drug candidates rather than selling established medicines at scale. That makes it very different from large pharmaceutical companies: the value of the business depends mainly on clinical trial progress, regulatory outcomes, and potential future partnerships.
The company’s lead programs are galinpepimut-S (GPS), an immunotherapy targeting the WT1 protein in cancer, and selasdenib, a targeted therapy for certain patients with acute myeloid leukemia carrying an IDH1 mutation. Sellas is primarily aiming at blood cancers and other hard-to-treat tumors where there is still meaningful unmet medical need.
At this stage, revenue is very limited and irregular. Based on recent annual reporting, the company has not been generating recurring commercial product sales, so its economic model depends mainly on financing activities and, when available, collaboration or licensing-related inflows rather than steady operating revenue.
The revenue mix has therefore been highly concentrated and volatile:
- Collaboration, licensing, or other operating revenue: historically close to 100% of reported revenue when revenue is present. This can include milestone-related or agreement-based inflows rather than repeat product sales.
- Product revenue: approximately 0% in recent periods, as the company does not yet have a broadly commercialized approved product.
- Other recurring operating sources: approximately 0% to negligible, based on recent filings.
This profile is important for long-term readers: Sellas is not currently a revenue-driven operating business in the traditional sense. It is better understood as a clinical-stage oncology developer whose future value could change sharply if one of its programs reaches a major development or regulatory milestone.
Operating expenses have been led by research and development, with general and administrative costs as the second-largest use of cash. Over the last several years, total spending has remained meaningful while revenue has fallen to zero, which highlights how dependent the company remains on external capital until a partnership, approval, or commercialization path becomes more tangible.
The expense profile shows a classic biotech pattern: research and development is the largest cash use, and losses have narrowed somewhat as spending has become more controlled. That said, the key issue remains unchanged: costs are still being funded ahead of meaningful recurring revenue.
Key Figures
| Metric | Value | Sector ⓘ |
|---|---|---|
| Date | Oct 17, 2026 | |
| Context | ||
| Sector | Healthcare | |
| Industry | Biotechnology | |
| Market Cap ⓘ | $2.40B | |
| Beta ⓘ | 2.57 | |
Value (Cheapness) | ||
| P/E Ratio ⓘ | N/A | 24.79 |
| P/B Ratio ⓘ | 15.58 | 3.08 |
| FCF Yield ⓘ | -1.18% | 3.15% |
| Dividend Yield ⓘ | N/A | 1.94% |
| EBIT / EV ⓘ | -1.60% | 0.57% |
| PEG ⓘ | N/A | |
Growth (Business expansion) | ||
| Revenue Growth ⓘ | -82.50% | 7.45% |
| RPS Growth (5Y CAGR) ⓘ | N/A | 8.61% |
| EPS Growth (5Y CAGR) ⓘ | -52.52% | -17.81% |
| BVPS Growth (5Y CAGR) ⓘ | -16.14% | 3.72% |
| Margin Growth (5Y Trend) ⓘ | N/A | -0.62% |
| FCF Growth (5Y CAGR) ⓘ | N/A | 1.04% |
| DPS Growth (5Y CAGR) ⓘ | N/A | 6.77% |
Quality (Business durability) | ||
| ROIC (Latest) ⓘ | -30.14% | 3.24% |
| ROA (Latest) ⓘ | -32.97% | 3.01% |
| ROIC (5Y Median) ⓘ | -130.54% | 4.60% |
| ROA (5Y Median) ⓘ | -174.38% | 1.89% |
| Net Debt / EBIT (Latest) ⓘ | N/A | 1.34 |
| Net Debt / EBIT (5Y Median) ⓘ | N/A | 1.84 |
| Net Debt / EBITDA (Latest) ⓘ | N/A | 1.00 |
| Net Debt / Assets ⓘ | -94.72% | 5.45% |
| EBITDA / Interest ⓘ | N/A | 9.64 |
| Operating Margin (Latest) ⓘ | N/A | 9.27% |
| Operating Margin (5Y Median) ⓘ | N/A | 7.38% |
| Debt to Equity (Latest) ⓘ | 0.54% | 28.58% |
| Profit Margin (Latest) ⓘ | N/A | 3.59% |
| Free Cash Flow (Latest) ⓘ | -$28.42M | |
Momentum (Price trend) | ||
| 3Y Return ⓘ | +792.91% | +42.80% |
| 12M Return (excl. last month) ⓘ | +572.02% | +18.50% |
| 6M Return ⓘ | +130.96% | +7.57% |
| Price vs. 200-Day MA ⓘ | +38.50% | +5.12% |
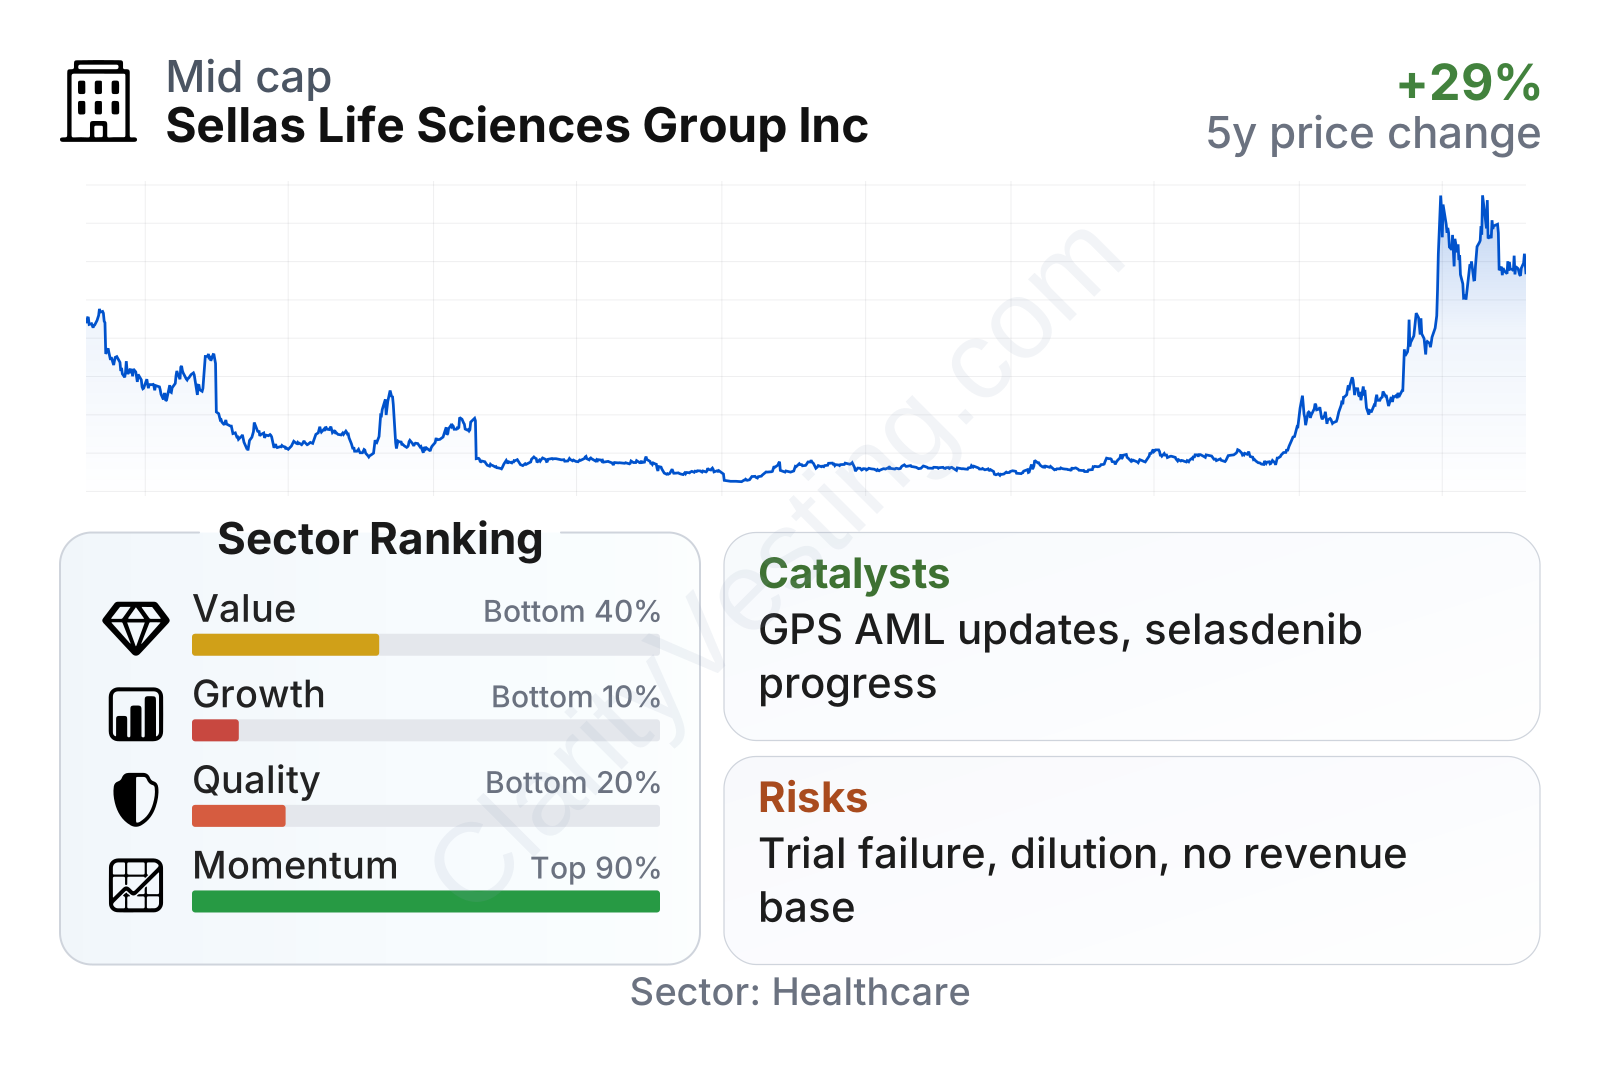
Sellas now sits in a much stronger stock-price position than most biotech peers over the last 6 to 36 months, but that market strength stands in clear contrast to weak fundamental rankings in value, quality, and growth. The company remains small by healthcare standards, highly volatile, and largely priced on expectations around pipeline progress rather than present-day operating performance.
Growth
Sellas operates in oncology, one of the most active and best-funded areas in biotechnology. Cancer drug development remains a large and growing segment because demand is supported by aging populations, ongoing scientific advances, and the willingness of larger pharmaceutical groups to acquire or license promising assets. In that sense, the company is positioned in a sector with long-term strategic relevance.
The main question is not whether the sector is attractive, but whether Sellas can translate its pipeline into clinical proof and commercial relevance. Its strategy is logical for a company of its size: focus resources on a limited number of late-clinical or potentially differentiated oncology programs, seek data that could support regulatory discussions, and preserve optionality for partnerships.
The most important growth catalyst is the continued development of galinpepimut-S in acute myeloid leukemia, particularly in the maintenance setting where a positive outcome could materially change the company’s profile. A second meaningful driver is selasdenib, which gives the company exposure to precision oncology in a genetically defined patient population. If either asset produces stronger evidence of efficacy or safety than currently available alternatives, the company’s strategic value could rise quickly.
Recent company communications have also emphasized regulatory and clinical milestones, including updates around ongoing studies and interactions tied to development planning. For a biotech company at this stage, those events matter more than short-term revenue trends because they shape the probability of future licensing, approval, and commercialization.
Reported revenue growth has been extremely weak, but that is not the main lens through which this company is usually assessed. Because revenue has been sporadic and non-recurring, year-over-year changes mostly reflect the absence of deal-related income rather than a deterioration in a mature operating franchise.
Cash generation remains negative, although cash burn has improved from its worst levels. That suggests some discipline on spending, but not self-funding capacity. Future growth therefore still depends on trial execution and access to capital, not on internally generated cash.
Risks
This article is for informational purposes only and does not constitute financial advice. Some content is AI-generated. See Disclaimer


