Stock Analysis · A. Schulman Inc (SLMNP)
Overview
A. Schulman Inc was historically known as a plastics compounder and resin distributor serving packaging, automotive, consumer, construction, and industrial end markets. However, that is not the business represented by the current quoted security anymore. A. Schulman was acquired by LyondellBasell in 2018, and the ticker referenced here, SLMNP, now reflects a preferred security tied to a much larger chemicals group rather than the old standalone A. Schulman operating company.
That distinction matters for long-term analysis: the underlying economic exposure is effectively to a diversified global chemicals producer with operations spanning commodity and specialty chemicals, polymers, and refining-related activities. Based on the available financial profile, revenue is no longer best understood through A. Schulman’s former niche business lines, but through the broader parent company structure.
Public company materials indicate revenue is generated mainly from large chemical and polymer segments rather than from a single narrow plastics compounding franchise. The broad revenue mix is generally driven by:
- Olefins and polyolefins businesses: large-scale production of polyethylene and polypropylene used in packaging, consumer goods, pipes, automotive parts, and industrial applications.
- Intermediates and derivatives: chemicals used in construction materials, coatings, solvents, fuels blending, and industrial processes.
- Advanced or value-added polymer solutions: materials tailored for performance requirements such as durability, flexibility, appearance, and processing.
- Other activities including refining-related operations: depending on the corporate structure and reporting period, this can include feedstocks and co-products that support the main chemicals chain.
For readers focused on the security itself, the central point is that this is not a straightforward small or mid-sized specialty materials company anymore. It sits within a much broader chemicals platform, which changes how revenue stability, leverage, margins, and valuation should be interpreted.
The income profile shown here points to a business with solid gross profitability but meaningful pressure from financing costs. Operating income remains substantial, yet interest expense absorbs a very large share of it, which helps explain why bottom-line profitability and cash generation look much weaker than headline operating margin alone would suggest.
Key Figures
| Metric | Value | Sector ⓘ |
|---|---|---|
| Date | Oct 24, 2026 | |
| Context | ||
| Sector | Basic Materials | |
| Industry | Chemicals | |
| Market Cap ⓘ | $25.22B | |
| Beta ⓘ | -1.47 | |
Value (Cheapness) | ||
| P/E Ratio ⓘ | N/A | 16.92 |
| P/B Ratio ⓘ | 111.41 | 1.66 |
| FCF Yield ⓘ | -0.22% | 5.83% |
| Dividend Yield ⓘ | 0.10% | 2.07% |
| EBIT / EV ⓘ | 3.64% | 6.38% |
| PEG ⓘ | N/A | |
Growth (Business expansion) | ||
| Revenue Growth ⓘ | 11.80% | 11.25% |
| RPS Growth (5Y CAGR) ⓘ | 22.51% | 4.49% |
| EPS Growth (5Y CAGR) ⓘ | -44.89% | -15.24% |
| BVPS Growth (5Y CAGR) ⓘ | -0.59% | 5.49% |
| Margin Growth (5Y Trend) ⓘ | -9.51% | -1.54% |
| FCF Growth (5Y CAGR) ⓘ | N/A | 0.37% |
| DPS Growth (5Y CAGR) ⓘ | 90.30% | 5.91% |
Quality (Business durability) | ||
| ROIC (Latest) ⓘ | N/A | 9.59% |
| ROA (Latest) ⓘ | 1.34% | 4.92% |
| ROIC (5Y Median) ⓘ | N/A | 7.91% |
| ROA (5Y Median) ⓘ | 2.36% | 3.92% |
| Net Debt / EBIT (Latest) ⓘ | 1.42 | 1.36 |
| Net Debt / EBIT (5Y Median) ⓘ | 0.80 | 1.69 |
| Net Debt / EBITDA (Latest) ⓘ | 1.41 | 0.93 |
| Net Debt / Assets ⓘ | 4.83% | 13.69% |
| EBITDA / Interest ⓘ | 1.14 | 12.38 |
| Operating Margin (Latest) ⓘ | 53.28% | 13.24% |
| Operating Margin (5Y Median) ⓘ | 54.09% | 11.82% |
| Debt to Equity (Latest) ⓘ | 288.63% | 40.30% |
| Profit Margin (Latest) ⓘ | 1.28% | 6.38% |
| Free Cash Flow (Latest) ⓘ | -$55.65M | |
Momentum (Price trend) | ||
| 3Y Return ⓘ | +22.52% | +73.47% |
| 12M Return (excl. last month) ⓘ | +2.27% | +27.59% |
| 6M Return ⓘ | +2.02% | -4.02% |
| Price vs. 200-Day MA ⓘ | +3.68% | -0.65% |
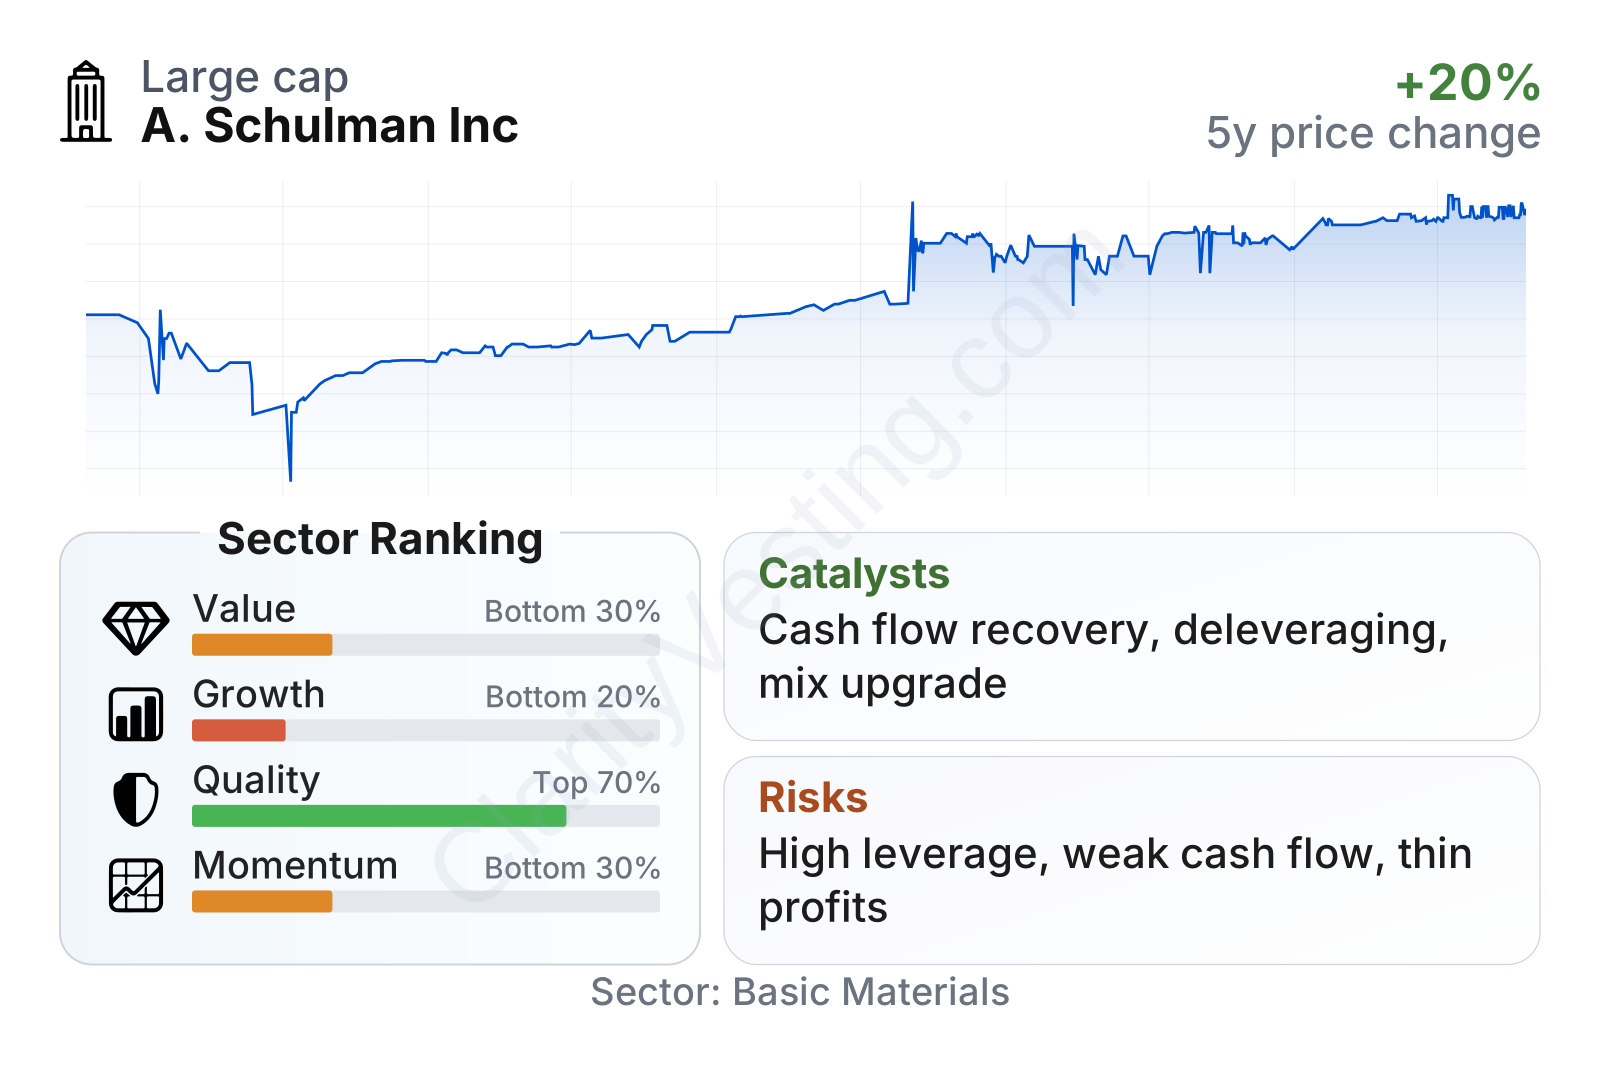
The stock has been relatively stable to modestly higher over the past several years, but its market performance has lagged much of the broader Basic Materials sector. In the factor table, the strongest area is operating profitability on paper, while the weakest areas are valuation, growth quality, and momentum. The combination is unusual: reported operating margins appear very high, yet free cash flow is negative, net profit is thin, and balance-sheet leverage is elevated. That gap suggests readers should treat the headline margin profile with caution and focus more on earnings quality, interest burden, and cash conversion.
Growth
The chemicals and polymers market is a structurally important sector because it feeds into packaging, transportation, infrastructure, appliances, healthcare products, and consumer goods. Over the long run, demand tends to rise with industrial production, population growth, and replacement of traditional materials by engineered plastics and specialty compounds. That gives the business a real economic role, but it is not a simple high-growth industry. Growth usually depends on capacity additions, feedstock advantages, product mix upgrades, and disciplined capital allocation.
Recent growth signals are mixed. Revenue growth has been slightly above the sector median on a year-over-year basis, and the longer-term revenue-per-share trend is strong. That suggests the platform has still been able to expand its commercial footprint. But earnings growth tells a very different story: five-year EPS contraction and weakening margin trend indicate that sales growth has not translated efficiently into shareholder earnings.
For long-term positioning, the strategic logic still makes sense if management can keep shifting toward higher-value materials, improve product mix, and extract more value from scale. In chemicals, scale matters because purchasing, logistics, manufacturing utilization, and customer relationships can create advantages across cycles. If the business can stabilize its cost base and reduce the drag from financing, operating leverage could improve meaningfully.
One important point is that cash generation has not recently supported the operating narrative. Free cash flow is negative on a trailing basis, which limits flexibility for debt reduction, distributions, and major reinvestment unless underlying cash conversion improves.
The most visible potential catalyst is therefore not simply end-market growth, but improvement in financial efficiency: better conversion of revenue into cash, lower financing pressure, and a clearer alignment between operating profit and net profit. In a cyclical industry, that often matters more than top-line growth alone.
Risks
This article is for informational purposes only and does not constitute financial advice. Some content is AI-generated. See Disclaimer


