Stock Analysis · SLM Corp Pb Pref (SLMBP)
Overview
SLM Corp is the parent company of Sallie Mae, a well-known name in U.S. education finance. The company primarily makes and services private student loans for undergraduate, graduate, and professional students, and it also gathers deposits through its online bank to fund those loans. In simple terms, it is a specialized lender focused on helping students and families finance higher education when federal aid does not fully cover costs.
The business is concentrated rather than broadly diversified. Based on recent annual reporting, the largest revenue drivers come from net interest income earned on private education loans, followed by fees and other non-interest income tied to servicing, origination, and related banking activities. Because SLM operates mainly as a specialized education lender, its earnings are highly linked to loan growth, credit quality, funding costs, and repayment behavior.
The revenue mix is best understood as follows:
- Net interest income from private education loans: approximately 80% to 90% of total revenue. This is the spread between what the company earns on loans and what it pays to fund itself, mainly through deposits and other borrowings.
- Other non-interest income: approximately 10% to 20% of total revenue. This includes loan-related fees, servicing-related items, and other banking income.
That concentration can be a strength because the company knows its niche well, but it also means performance depends heavily on the health of the student lending market and the economics of consumer credit.
The long-term picture shows revenue rising from roughly $2.4 billion in 2021 to just above $3.1 billion in 2025, with profitability recovering after a weaker 2022. At the same time, interest expense became much heavier in 2024 and 2025, which matters because funding costs are a major driver of earnings for a lender.
Key Figures
| Metric | Value | Sector ⓘ |
|---|---|---|
| Date | Oct 03, 2026 | |
| Context | ||
| Sector | Financial Services | |
| Industry | Credit Services | |
| Market Cap ⓘ | $4.83B | |
| Beta ⓘ | 0.97 | |
Value (Cheapness) | ||
| P/E Ratio ⓘ | 34.41 | 12.60 |
| P/B Ratio ⓘ | 5.62 | 1.23 |
| FCF Yield ⓘ | 13.44% | 10.16% |
| Dividend Yield ⓘ | 0.71% | 2.96% |
| EBIT / EV ⓘ | 6.41% | 7.77% |
| PEG ⓘ | N/A | |
Growth (Business expansion) | ||
| Revenue Growth ⓘ | 8.10% | 9.50% |
| RPS Growth (5Y CAGR) ⓘ | 18.82% | 12.10% |
| EPS Growth (5Y CAGR) ⓘ | 7.43% | -9.45% |
| BVPS Growth (5Y CAGR) ⓘ | -36.33% | 5.01% |
| Margin Growth (5Y Trend) ⓘ | -32.01% | -4.07% |
| FCF Growth (5Y CAGR) ⓘ | N/A | 4.96% |
| DPS Growth (5Y CAGR) ⓘ | 101.79% | 8.79% |
Quality (Business durability) | ||
| ROIC (Latest) ⓘ | 8.80% | 9.60% |
| ROE (Latest) ⓘ | 30.54% | 13.84% |
| ROA (Latest) ⓘ | 2.53% | 1.53% |
| ROIC (5Y Median) ⓘ | 9.08% | 7.86% |
| ROE (5Y Median) ⓘ | 30.11% | 12.20% |
| ROA (5Y Median) ⓘ | 2.05% | 1.29% |
| Net Debt / EBIT (Latest) ⓘ | 1.28 | 0.91 |
| Net Debt / EBIT (5Y Median) ⓘ | 1.04 | 0.74 |
| Net Debt / EBITDA (Latest) ⓘ | 1.26 | 0.97 |
| Operating Margin (Latest) ⓘ | 32.02% | 22.12% |
| Operating Margin (5Y Median) ⓘ | 31.92% | 24.39% |
| Debt to Equity (Latest) ⓘ | 236.16% | 60.37% |
| Profit Margin (Latest) ⓘ | 43.63% | 26.62% |
| Free Cash Flow (Latest) ⓘ | $649.50M | |
Momentum (Price trend) | ||
| 3Y Return ⓘ | +56.08% | +89.23% |
| 12M Return (excl. last month) ⓘ | +7.00% | +17.35% |
| 6M Return ⓘ | +4.58% | +10.00% |
| Price vs. 200-Day MA ⓘ | +2.54% | +3.73% |
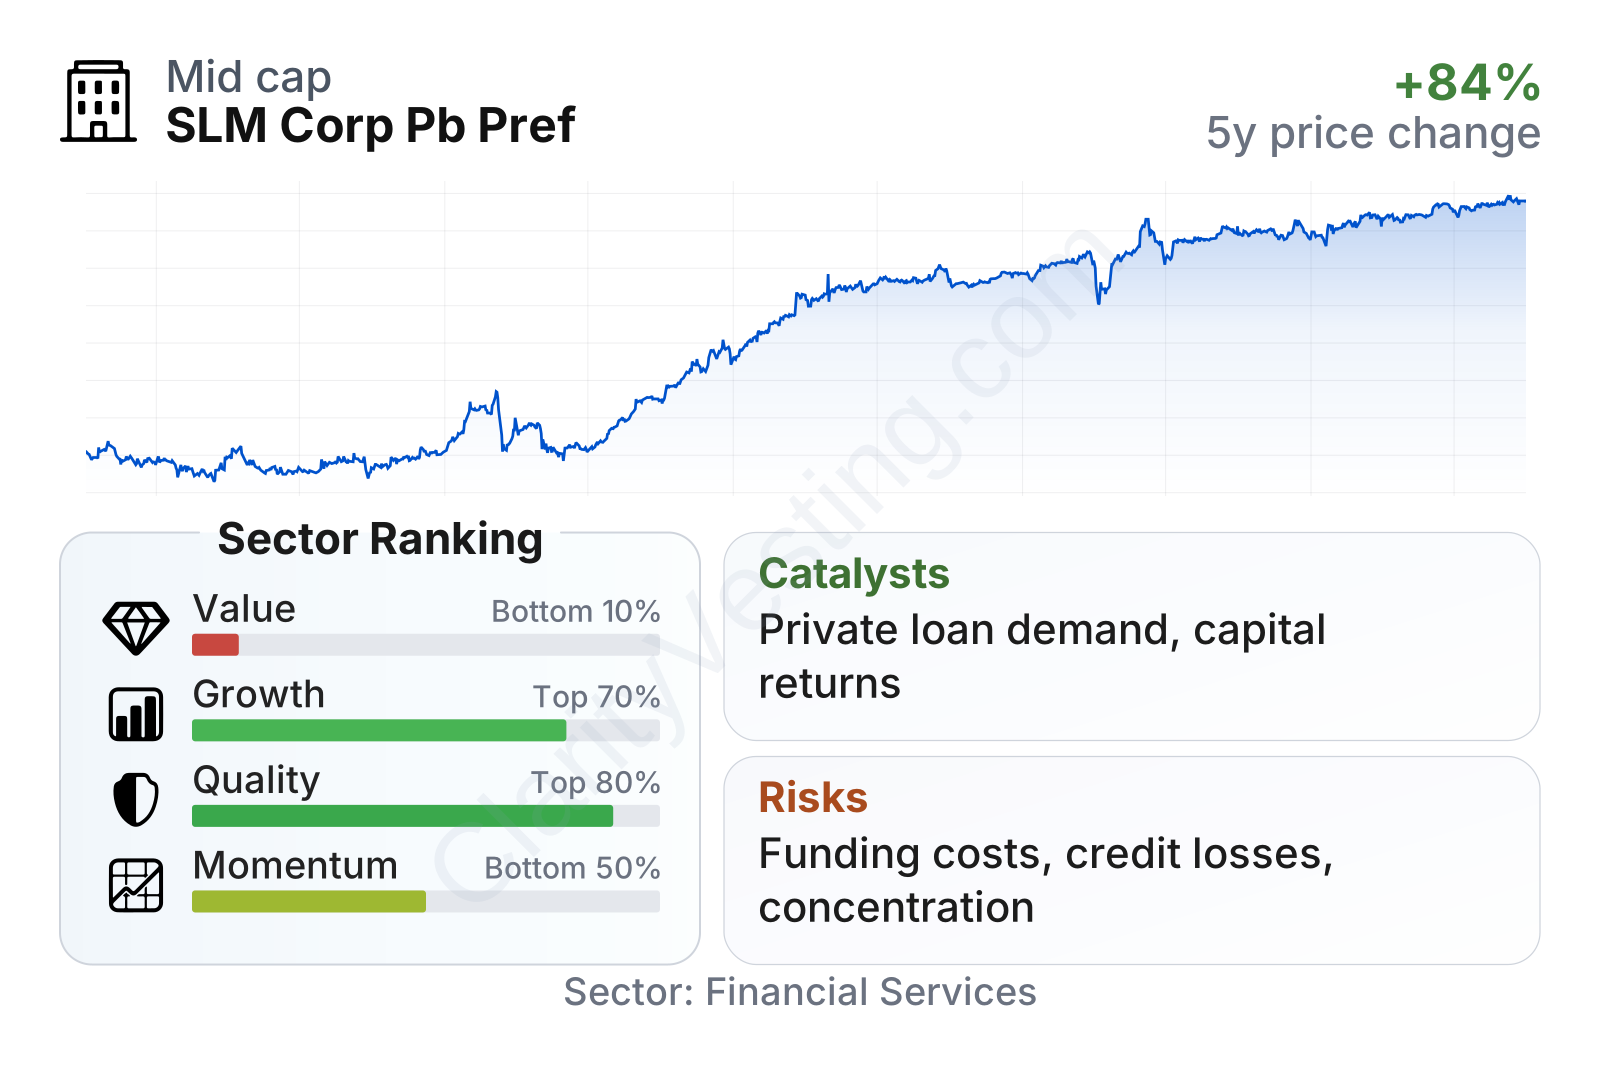
SLM sits in the mid-cap range, with share-price volatility close to the broader market rather than extreme. The quality profile is strong relative to much of the financial services sector, helped by high profitability ratios and solid free cash generation. Growth is more mixed: multi-year revenue-per-share and earnings trends look favorable, but recent revenue growth has been only slightly below the sector median, and book value trends have been unusual and weaker than peers over five years. The weakest area is valuation, where the stock trades well above sector medians on both earnings and book value measures.
Growth
SLM operates in a part of finance that has a durable underlying demand base. College remains expensive in the United States, and many households still need financing beyond scholarships, savings, and federal student aid. That does not guarantee fast growth every year, but it does create a steady need for education lending. For a specialist like Sallie Mae, that niche can support long-term business volume if underwriting remains disciplined.
The company’s strategy is straightforward and logically consistent: originate private student loans, keep a meaningful portion on balance sheet, fund them with deposits, and use servicing capabilities and school relationships to support repeat volume. This model can work well when credit performance stays healthy and funding remains available at acceptable cost. It is less dependent on rapid product expansion than some lenders because its strength comes from focus and scale in one category.
Earnings per share moved higher between late 2024 and mid-2025, which fits with the broader picture of earnings recovery after earlier pressure. Over five years, earnings growth has outpaced much of the sector, even if the path has not been smooth. That matters for a lender because long-term value creation depends not just on loan growth, but on turning that growth into durable profits.
Book value per share improved from 2022 through 2025, suggesting balance-sheet rebuilding after a sharp earlier drop. Even so, the five-year trend remains weak because of the very low base reached in 2022. For a financial company, this is an important point: recent repair is encouraging, but the longer record still shows that capital metrics have gone through an unusually volatile period.
A practical catalyst is the possibility of continued private student loan demand if tuition inflation and family funding gaps persist. Another is operating leverage: if originations hold up while credit stays controlled, incremental revenue can flow through profitably. Recent company reporting has also pointed to ongoing capital returns, which can support per-share results when earnings are stable. None of these are transformational on their own, but together they can reinforce steady long-term progress.
Risks
This article is for informational purposes only and does not constitute financial advice. Some content is AI-generated. See Disclaimer


