Stock Analysis · SL Green Realty Corp (SLG-PI)
Overview
SL Green Realty Corp is a real estate investment trust focused mainly on office properties in Manhattan. The company owns, manages, leases, finances, and repositions office buildings, and it also has exposure to retail space located within or around those properties. In practice, SL Green’s business is tied closely to the health of the New York City office market, especially high-quality buildings in central business districts.
Its revenue mix is shaped first by recurring property income and second by transaction-related and investment activity. Based on recent annual reporting and segment disclosures, the business is primarily driven by rental income from wholly owned office properties, with smaller contributions from debt and preferred equity investments, joint venture income, fee income, and gains or other transactional items that can vary materially from year to year.
- Rental revenue from office properties: approximately 70% to 80% of total revenue in a typical year. This includes base rent, escalation revenue, and other tenant reimbursements tied to building operations.
- Investment and other income: approximately 10% to 20%. This may include interest income, preferred equity income, and returns from real estate-related investments.
- Fee, ancillary, and transactional revenue: approximately 5% to 15%. This can include property management, leasing, advisory activities, and gains linked to asset sales or other transactions, which are often less predictable.
That structure makes SL Green different from a broadly diversified REIT. It is more concentrated geographically and operationally, which can amplify both upside and downside depending on conditions in Manhattan leasing, occupancy, financing markets, and asset values.
The recent profit flow shows a business with uneven earnings quality. Revenue rebounded strongly in 2025 after a weaker 2024, but interest expense has risen sharply over the last several years, which has limited the translation of revenue into net profit. That pattern matters because office real estate can look healthier at the property level than at the shareholder level when financing costs stay elevated.
Key Figures
| Metric | Value | Sector ⓘ |
|---|---|---|
| Date | Oct 17, 2026 | |
| Context | ||
| Sector | Real Estate | |
| Industry | REIT - Office | |
| Market Cap ⓘ | $6.17B | |
| Beta ⓘ | 1.66 | |
Value (Cheapness) | ||
| P/E Ratio ⓘ | 3.12 | 17.38 |
| P/B Ratio ⓘ | 0.67 | 0.85 |
| FCF Yield ⓘ | -0.60% | 7.38% |
| Dividend Yield ⓘ | 15.61% | 4.85% |
| EBIT / EV ⓘ | 2.54% | 3.78% |
| PEG ⓘ | N/A | |
Growth (Business expansion) | ||
| Revenue Growth ⓘ | 27.30% | 5.30% |
| RPS Growth (5Y CAGR) ⓘ | 3.58% | 6.02% |
| EPS Growth (5Y CAGR) ⓘ | 0.52% | -11.37% |
| BVPS Growth (5Y CAGR) ⓘ | -10.17% | 0.45% |
| Margin Growth (5Y Trend) ⓘ | -0.00% | -0.22% |
| FCF Growth (5Y CAGR) ⓘ | -24.56% | 5.40% |
| DPS Growth (5Y CAGR) ⓘ | -2.58% | 5.02% |
Quality (Business durability) | ||
| ROIC (Latest) ⓘ | 2.90% | 5.69% |
| ROE (Latest) ⓘ | -6.00% | 7.56% |
| ROA (Latest) ⓘ | -1.51% | 2.85% |
| ROIC (5Y Median) ⓘ | 1.02% | 4.22% |
| ROE (5Y Median) ⓘ | -2.07% | 6.03% |
| ROA (5Y Median) ⓘ | -0.61% | 2.44% |
| Net Debt / EBIT (Latest) ⓘ | 22.22 | 7.59 |
| Net Debt / EBIT (5Y Median) ⓘ | 50.27 | 8.40 |
| Net Debt / EBITDA (Latest) ⓘ | 9.98 | 5.27 |
| Net Debt / Assets ⓘ | 42.22% | 37.76% |
| EBITDA / Interest ⓘ | 2.14 | 4.10 |
| Operating Margin (Latest) ⓘ | 21.60% | 35.29% |
| Operating Margin (5Y Median) ⓘ | 13.98% | 37.31% |
| Debt to Equity (Latest) ⓘ | 151.16% | 88.87% |
| Profit Margin (Latest) ⓘ | -16.72% | 19.61% |
| Free Cash Flow (Latest) ⓘ | -$36.85M | |
Momentum (Price trend) | ||
| 3Y Return ⓘ | +45.92% | +30.75% |
| 12M Return (excl. last month) ⓘ | +0.54% | +4.36% |
| 6M Return ⓘ | +5.19% | -2.52% |
| Price vs. 200-Day MA ⓘ | +2.38% | -2.34% |
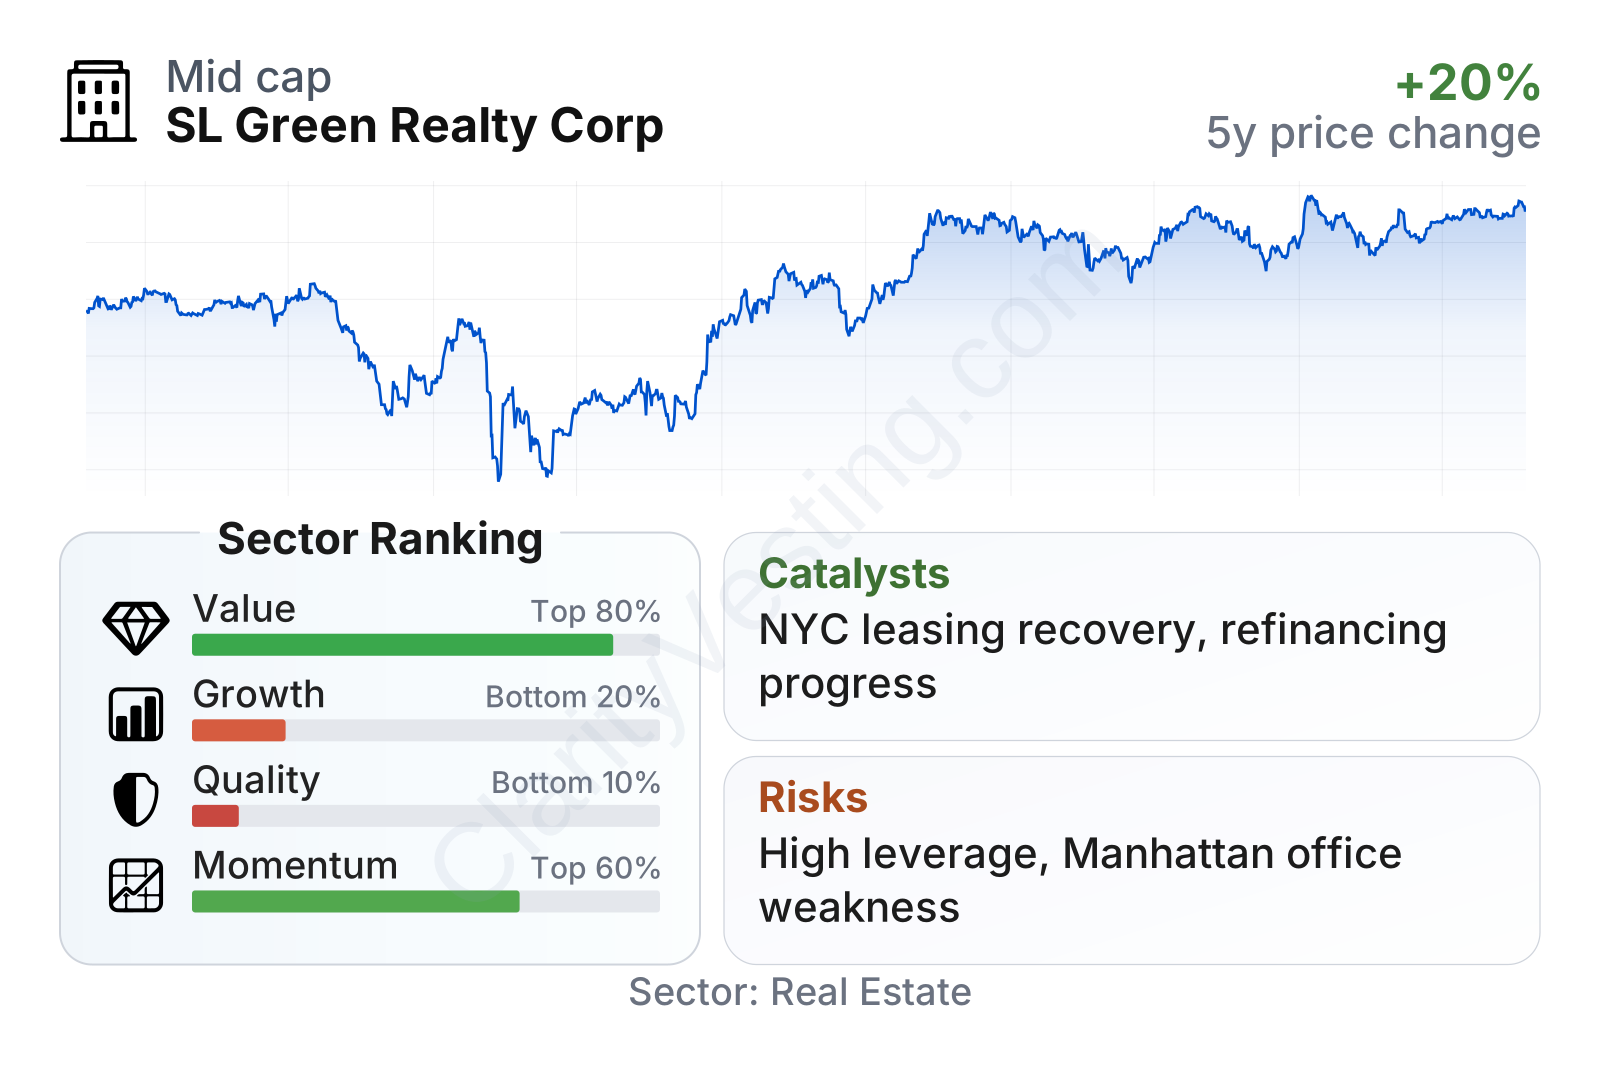
SL Green is a mid-sized public REIT with above-average share-price volatility, which fits a company tied to a cyclical and closely watched part of commercial real estate. On valuation screens, the stock looks inexpensive relative to the broader real estate sector, with a low price-to-book ratio and a very low earnings multiple. However, those cheap-looking metrics sit next to weak quality measures: profitability trails sector norms, leverage is high, interest coverage is thin, and free cash flow is slightly negative. Growth signals are mixed as well. Recent year-over-year revenue growth has been strong, but the longer five-year pattern remains weaker than the sector on several measures, including free cash flow and book value per share.
Growth
SL Green operates in a sector that is still working through a major reset rather than enjoying straightforward expansion. Office real estate, especially in large cities, has faced pressure from hybrid work, tenant downsizing, and tighter lending conditions. At the same time, the strongest buildings in the best locations have generally held up better than older or less competitive assets. That is where SL Green is trying to position itself: premium Manhattan properties, active leasing, redevelopment, and selective capital recycling.
The basic strategy is coherent. In a market where weaker buildings can lose relevance, a landlord with scale, local relationships, and redevelopment expertise can gain share within the remaining demand pool. SL Green has long experience in Manhattan, a recognized local platform, and a portfolio centered on a market where supply is constrained by zoning, cost, and development complexity. If large tenants continue preferring top-tier locations and high-quality space, that could support occupancy, leasing spreads, and asset values for the better part of the portfolio.
One of the clearest potential catalysts is stabilization in New York office usage combined with lower financing pressure. A more normal interest-rate backdrop would help in two ways: it could improve real estate values and reduce stress on refinancing. Another potential support is the ongoing separation inside the office market between premium buildings and commodity space. If that gap widens further, owners of better-located assets may benefit even if the overall office sector remains challenged.
Recent company updates have also highlighted leasing execution, debt management, and asset monetization as key priorities. For SL Green, those are not side issues; they are the central bridge between a difficult office cycle and a more durable recovery. Progress on large leases, joint ventures, refinancings, and property sales can materially change the earnings outlook because of the company’s concentration and leverage.
Revenue per share has been uneven rather than steadily compounding. After improving in 2022, it softened in 2023 and 2024, then recovered sharply in 2025. That pattern suggests the company still has recovery potential, but it also shows that growth is sensitive to timing, transactions, and market conditions instead of being driven by a smooth, recurring expansion path.
The dividend history points to a similar conclusion. Per-share distributions trended lower for several years before a partial rebound in 2025. The yield remains very high, but for a long-term analysis the more important question is durability. In a leveraged office REIT, dividend strength depends heavily on leasing stability, access to capital, and refinancing terms rather than on headline yield alone.
Risks
This article is for informational purposes only and does not constitute financial advice. Some content is AI-generated. See Disclaimer


