Stock Analysis · Standard Life Aberdeen PLC (SLFPY)
Overview
Standard Life Aberdeen PLC, now widely known as abrdn, is a U.K.-based financial services group focused on managing money and helping individuals and institutions save, invest, and plan for retirement. Its business spans investment management, adviser platforms, and retail wealth solutions. In simple terms, the company earns fees for overseeing client assets, providing investment products, and offering technology and administration services to financial advisers and wealth clients.
The group’s revenue mix has shifted over time as it reshaped the business away from a broader insurance heritage and toward asset management and wealth. Based on recent company reporting, the largest operating income sources are broadly the following:
- Investments / asset management: approximately 45% to 55% of group revenue. This includes fees from managing mutual funds, institutional mandates, and specialist investment strategies for pension funds, insurers, sovereign clients, and retail investors.
- Interactive Investor / adviser and direct wealth platforms: approximately 25% to 35%. This includes platform fees, subscription-style charges, dealing income, and custody or administration services tied to retail investing and adviser-led assets.
- Adviser and personal wealth businesses: approximately 15% to 25%. This covers financial planning, advice, and wealth management activities aimed at individuals and intermediary channels.
- Other revenue and treasury-related items: generally a small residual share, including items that do not fit neatly into the main operating divisions.
That mix matters because the traditional asset-management business is sensitive to market levels and client flows, while platform and wealth activities can be steadier and more recurring. Over the last few years, the company has been trying to make that revenue base more balanced.
The profit path has also been uneven. Revenue declined from 2021 through 2024 before recovering strongly in 2025, while profitability improved much more sharply in 2025 than in prior years. Operating costs have come down from earlier peaks, especially in selling and administrative expenses, which suggests restructuring efforts are starting to show through.
Key Figures
| Metric | Value | Sector ⓘ |
|---|---|---|
| Date | Oct 03, 2026 | |
| Context | ||
| Sector | Financial Services | |
| Industry | Asset Management | |
| Market Cap ⓘ | $6.04B | |
| Beta ⓘ | 1.40 | |
Value (Cheapness) | ||
| P/E Ratio ⓘ | 11.72 | 12.60 |
| P/B Ratio ⓘ | 1.15 | 1.23 |
| FCF Yield ⓘ | 9.32% | 10.16% |
| Dividend Yield ⓘ | 5.99% | 2.96% |
| EBIT / EV ⓘ | N/A | 7.77% |
| PEG ⓘ | 1.21 | |
Growth (Business expansion) | ||
| Revenue Growth ⓘ | 3.00% | 9.50% |
| RPS Growth (5Y CAGR) ⓘ | 5.51% | 12.10% |
| EPS Growth (5Y CAGR) ⓘ | N/A | -9.45% |
| BVPS Growth (5Y CAGR) ⓘ | -6.28% | 5.01% |
| Margin Growth (5Y Trend) ⓘ | 10.33% | -4.07% |
| FCF Growth (5Y CAGR) ⓘ | 277.46% | 4.96% |
| DPS Growth (5Y CAGR) ⓘ | 0.01% | 8.79% |
Quality (Business durability) | ||
| ROIC (Latest) ⓘ | 9.49% | 9.60% |
| ROE (Latest) ⓘ | 14.09% | 13.84% |
| ROA (Latest) ⓘ | 7.79% | 1.53% |
| ROIC (5Y Median) ⓘ | 1.98% | 7.86% |
| ROE (5Y Median) ⓘ | 4.79% | 12.20% |
| ROA (5Y Median) ⓘ | 3.01% | 1.29% |
| Net Debt / EBIT (Latest) ⓘ | -1.29 | 0.91 |
| Net Debt / EBIT (5Y Median) ⓘ | -4.43 | 0.74 |
| Net Debt / EBITDA (Latest) ⓘ | -0.92 | 0.97 |
| Operating Margin (Latest) ⓘ | 18.32% | 22.12% |
| Operating Margin (5Y Median) ⓘ | 7.80% | 24.39% |
| Debt to Equity (Latest) ⓘ | 10.77% | 60.37% |
| Profit Margin (Latest) ⓘ | 28.07% | 26.62% |
| Free Cash Flow (Latest) ⓘ | $563.03M | |
Momentum (Price trend) | ||
| 3Y Return ⓘ | +115.33% | +89.23% |
| 12M Return (excl. last month) ⓘ | +34.07% | +17.35% |
| 6M Return ⓘ | +34.28% | +10.00% |
| Price vs. 200-Day MA ⓘ | +35.66% | +3.73% |
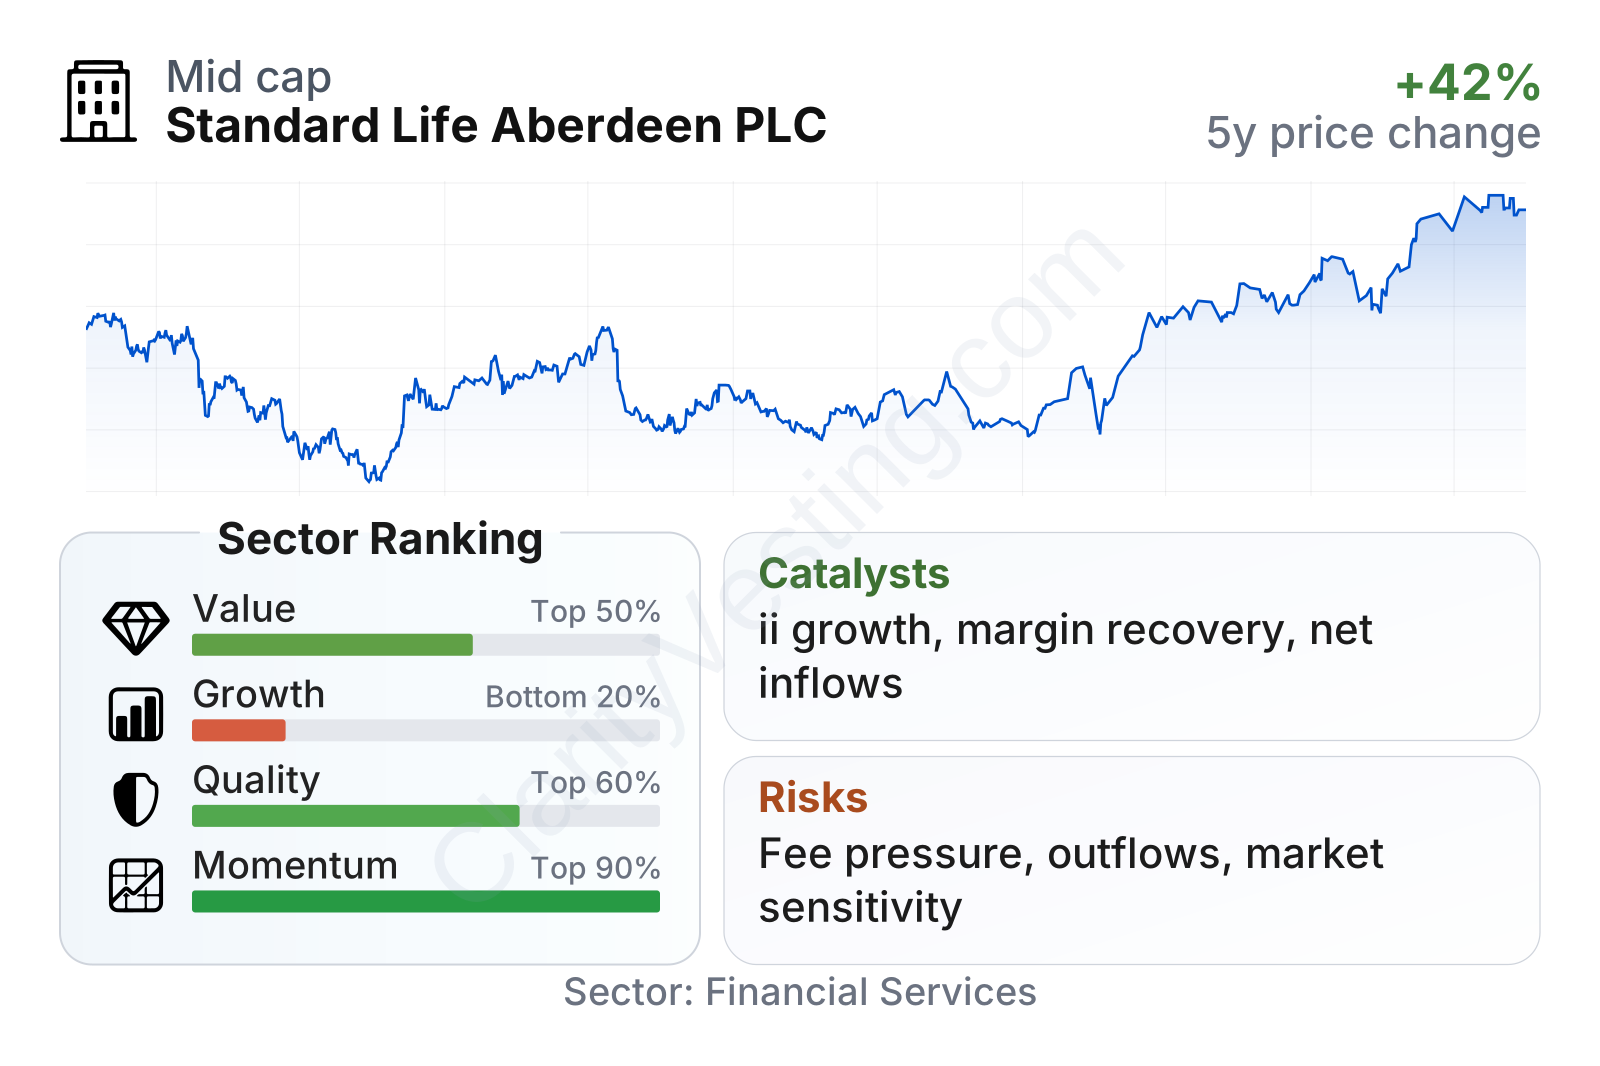
Standard Life Aberdeen is a mid-sized listed asset manager within a crowded financial services sector. On current valuation measures, it sits around the sector middle: earnings and book-value multiples are slightly below typical peers, while the dividend yield is materially higher than the sector median. Profitability is mixed but respectable in the latest period, with returns on equity and invested capital close to or a bit above sector norms, and leverage remains conservative thanks to a net cash position rather than heavy debt. The weaker area is growth: recent revenue growth, long-term revenue-per-share expansion, and book-value compounding trail much of the sector, even though cash generation and recent share-price momentum have improved clearly.
Growth
The company operates in a sector that should remain structurally relevant over the long run. Aging populations, the shift from state support toward private retirement savings, and the continued migration of savings into funds, platforms, and self-directed investment accounts all support demand for wealth and investment services. In that sense, Standard Life Aberdeen is exposed to a real long-term theme: more people need help managing retirement assets and long-term savings.
Its strategy also has a reasonable industrial logic. Traditional active asset management has become more competitive, with fee pressure and strong competition from passive products. To adapt, abrdn has been building a broader model that combines institutional and retail investment products with direct-to-consumer and adviser platforms. The acquisition and integration of Interactive Investor is particularly important because platform revenue tends to be more recurring and less tied to short-term market sentiment than pure fund-management fees.
Recent earnings progression points to some operational recovery.
Although the long-term growth profile remains weak versus many financial peers, earnings improved meaningfully from 2024 into 2025, and the rebound in operating income in 2025 was much stronger than the top-line increase alone. That usually signals better cost control, a more favorable business mix, or both. For a company coming out of a long restructuring phase, that shift is more important than simple headline revenue growth.
Balance-sheet value per share is another area to watch.
Book value per share fell materially between 2021 and 2023, then stabilized and edged up in 2024 and 2025. That pattern suggests the earlier period was marked by business pressure, market effects, or restructuring drag, while the more recent trend hints at firmer footing. It does not yet show a long and steady compounding record, but it does show that deterioration has slowed.
A near-term catalyst is the company’s continued push to improve efficiency and grow fee-based wealth and platform assets. If market levels remain supportive and net flows improve, revenue can benefit twice: from more assets on the platform and from higher asset values generating fees on existing accounts. Another meaningful opportunity is capital allocation. A company with modest debt, healthy cash generation, and a mature platform business has more flexibility to maintain distributions, repurchase shares, or reinvest selectively.
Risks
This article is for informational purposes only and does not constitute financial advice. Some content is AI-generated. See Disclaimer