Stock Analysis · Slide Insurance Holdings Inc (SLDE)
Overview
Slide Insurance Holdings Inc is a property and casualty insurer focused mainly on homeowners insurance in coastal markets, especially Florida. In simple terms, the company collects premiums from policyholders, invests part of that float, and then pays claims when covered events such as storms, fire, or other property losses occur. Slide has positioned itself as a technology-enabled insurer and managing general agent, aiming to use data, underwriting tools, and digital operations to price risk and handle policies more efficiently.
The business is concentrated in residential property coverage rather than a broad mix of insurance lines. Based on company disclosures, revenue is primarily tied to underwriting and related insurance operations, with a smaller contribution from investment income generated from the asset portfolio that supports insurance liabilities.
Main sources of revenue appear to be:
- Net premiums earned: the clear majority of revenue, likely around 85% to 95% in recent periods. This is the portion of customer premiums recognized over the life of insurance policies.
- Net investment income: a smaller but meaningful source, likely around 3% to 10%. This comes from investing premiums and reserves, typically in fixed-income securities and cash equivalents.
- Other insurance-related income: generally a limited share, likely below 5%, and may include fee-based activity, policy services, or other operating items depending on the reporting period.
What stands out is how quickly the company has scaled. Revenue rose from roughly $242 million in 2022 to about $1.16 billion in 2025, while net income also expanded sharply. Just as important, operating expenses have grown much more slowly than revenue, suggesting improving efficiency as the platform gets larger.
The financial flow over the last several years shows a business that has expanded fast while also widening margins. Revenue growth has been strong, and the gap between revenue and operating costs has increased materially, which helps explain the large rise in profits.
Key Figures
| Metric | Value | Sector ⓘ |
|---|---|---|
| Date | Nov 02, 2026 | |
| Context | ||
| Sector | Financial Services | |
| Industry | Insurance - Property & Casualty | |
| Market Cap ⓘ | $3.25B | |
| Beta ⓘ | N/A | |
Value (Cheapness) | ||
| P/E Ratio ⓘ | 6.27 | 12.21 |
| P/B Ratio ⓘ | 2.71 | 1.26 |
| FCF Yield ⓘ | 29.55% | 9.99% |
| Dividend Yield ⓘ | 0.25% | 2.87% |
| EBIT / EV ⓘ | 29.02% | 8.24% |
| PEG ⓘ | N/A | |
Growth (Business expansion) | ||
| Revenue Growth ⓘ | 35.90% | 8.20% |
| RPS Growth (5Y CAGR) ⓘ | -10.11% | 12.31% |
| EPS Growth (5Y CAGR) ⓘ | N/A | -3.82% |
| BVPS Growth (5Y CAGR) ⓘ | 7.80% | 4.96% |
| Margin Growth (5Y Trend) ⓘ | 38.71% | -4.14% |
| FCF Growth (5Y CAGR) ⓘ | 79.67% | 4.70% |
| DPS Growth (5Y CAGR) ⓘ | N/A | 8.85% |
Quality (Business durability) | ||
| ROIC (Latest) ⓘ | 48.33% | 9.35% |
| ROE (Latest) ⓘ | 48.26% | 14.02% |
| ROA (Latest) ⓘ | 20.09% | 1.57% |
| ROIC (5Y Median) ⓘ | N/A | 7.78% |
| ROE (5Y Median) ⓘ | 57.42% | 12.12% |
| ROA (5Y Median) ⓘ | 13.37% | 1.28% |
| Net Debt / EBIT (Latest) ⓘ | -2.24 | 0.99 |
| Net Debt / EBIT (5Y Median) ⓘ | -2.19 | 0.73 |
| Net Debt / EBITDA (Latest) ⓘ | -2.22 | 0.77 |
| Operating Margin (Latest) ⓘ | 50.62% | 22.64% |
| Operating Margin (5Y Median) ⓘ | 28.97% | 24.52% |
| Debt to Equity (Latest) ⓘ | 2.77% | 58.67% |
| Profit Margin (Latest) ⓘ | 39.28% | 26.18% |
| Free Cash Flow (Latest) ⓘ | $960.82M | |
Momentum (Price trend) | ||
| 3Y Return ⓘ | N/A | +95.38% |
| 12M Return (excl. last month) ⓘ | +41.80% | +16.18% |
| 6M Return ⓘ | +49.17% | +7.10% |
| Price vs. 200-Day MA ⓘ | +37.84% | +5.51% |
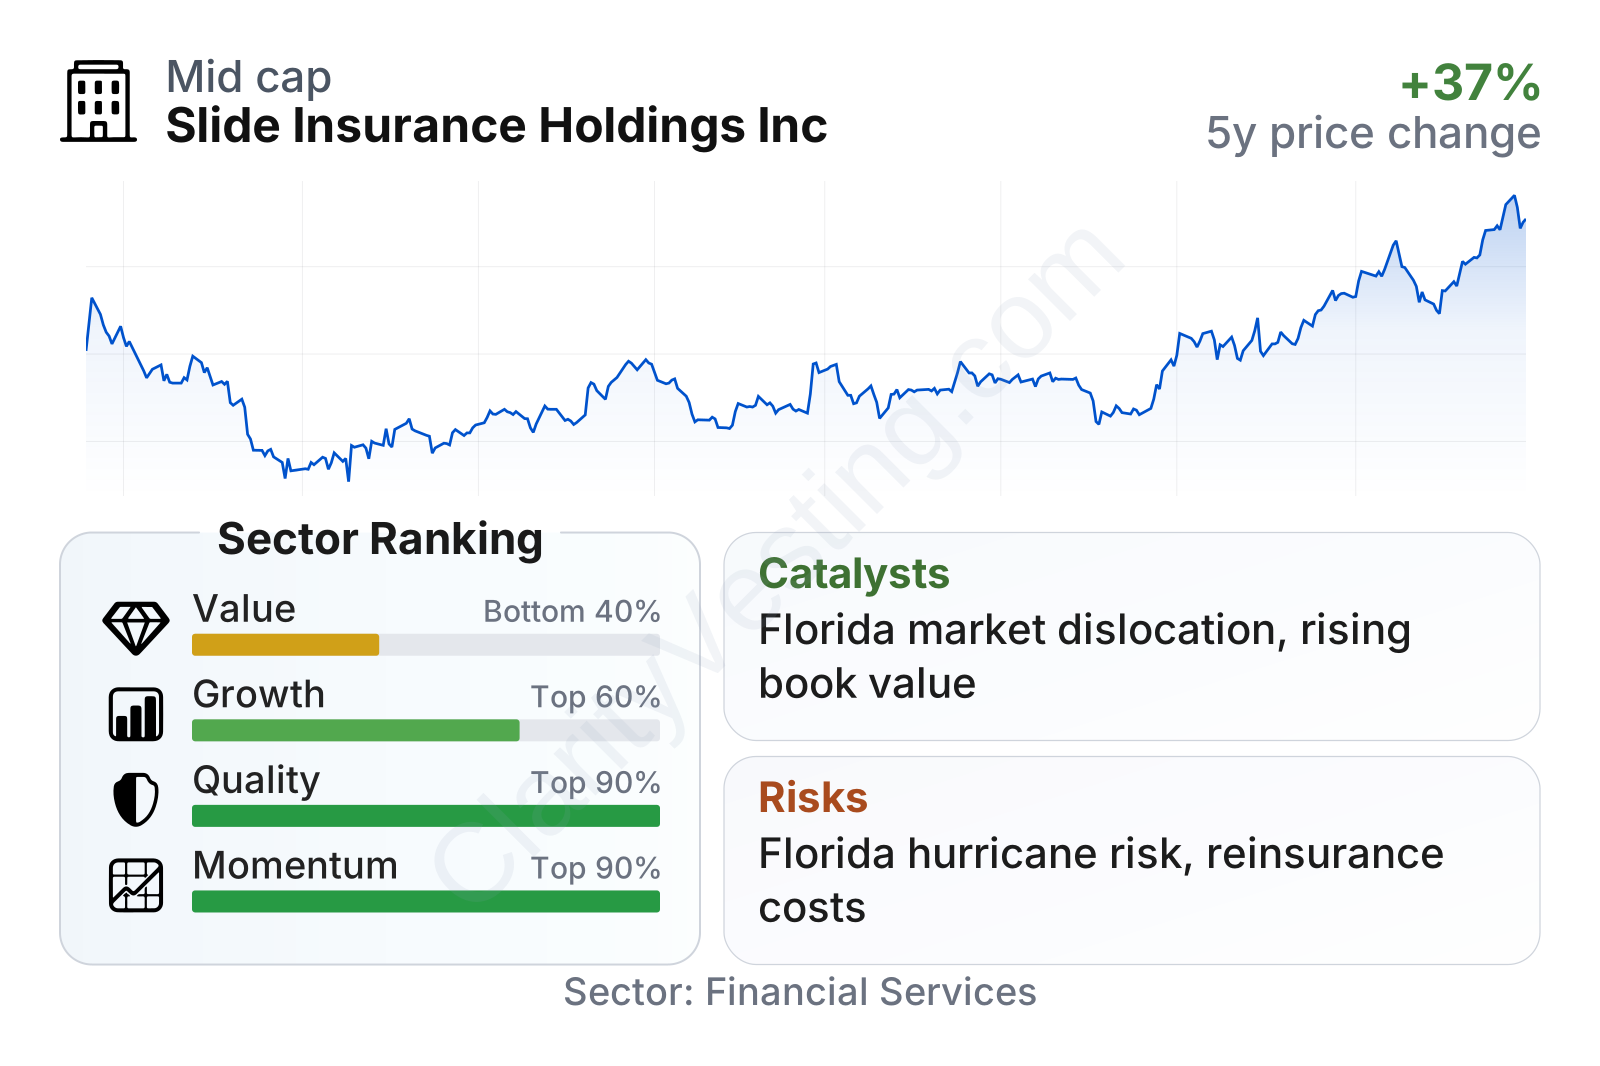
Slide looks unusual on a factor basis. It ranks very high on quality and momentum, helped by strong profitability, very low balance-sheet leverage, and share-price strength over recent months. Growth is above the sector median on recent revenue expansion and cash generation, although the longer multi-year revenue-per-share history is less smooth. The main offset is valuation: earnings-based measures look inexpensive, but book-value-based measures are noticeably richer than the sector norm.
The stock history has also been volatile since listing, which is common for a newer public insurer. After a weak patch, the shares recovered strongly into late 2026, showing that the market has become more confident in recent operating performance.
Growth
The company operates in a part of insurance that has real long-term demand. Homeowners coverage in catastrophe-exposed states is not optional for many property owners and mortgage borrowers, and capacity shortages in markets such as Florida can create room for disciplined insurers to gain share. That gives Slide an addressable market with structural need, even if it also brings higher risk.
Its strategy makes sense if execution remains disciplined. Slide has focused on underwriting residential property risk, using technology and analytics to select policies and price them more precisely. In insurance, growth is only valuable when pricing keeps pace with risk. So far, the company’s margins and returns suggest it has not simply expanded for volume alone.
Earnings progression has remained strong in the most recent periods shown, even with the natural quarter-to-quarter swings that insurers can experience. That supports the idea that recent profitability is not coming only from one short-lived event but from a broader improvement in scale and underwriting economics.
Book value per share is especially important for insurers because it reflects the capital base supporting future business. After earlier volatility, book value has risen sharply, and its five-year growth rate is ahead of the sector median. That matters because it gives the company more room to retain risk, support premium growth, and absorb shocks.
There are also some practical catalysts behind future expansion. Florida’s property insurance market has gone through years of disruption, with some carriers exiting, shrinking, or raising rates aggressively. A company that can write business selectively and maintain capital flexibility can benefit from that shakeout. In addition, higher interest rates have improved the income insurers can earn on invested assets, which can support earnings beyond underwriting results alone.
Recent company materials and SEC filings also point to continued premium growth, strong cash generation, and a balance sheet that has remained conservatively levered. For a relatively young public insurer, that combination is a meaningful sign that the platform still has room to mature.
Risks
This article is for informational purposes only and does not constitute financial advice. Some content is AI-generated. See Disclaimer