Stock Analysis · Skyward Specialty Insurance Group Inc (SKWD)
Overview
Skyward Specialty Insurance Group is a U.S. property and casualty insurer focused on specialty markets. In simple terms, it sells insurance for risks that are harder to price or require deeper underwriting expertise than standard personal or commercial policies. The company operates through a group of niche businesses serving areas such as accident and health, captives, global property and agriculture, professional lines, and surety and credit. Its model is built around selecting narrower markets where pricing discipline and specialized knowledge can matter more than scale alone.
The company makes money mainly from two engines: underwriting profit and investment income. Underwriting profit comes from premiums collected minus claims and operating costs. Investment income comes from investing the float, which is the pool of premiums held before claims are paid. In specialty insurance, both matter, but underwriting quality is especially important because poor pricing can erase years of gains very quickly.
Based on recent company disclosures, the main revenue sources can be summarized as follows:
- Net earned premiums: approximately 75% to 85% of total revenue. This is the core insurance revenue recognized over the life of policies written across the company’s specialty lines.
- Net investment income: approximately 10% to 20% of total revenue. This reflects income from the investment portfolio, helped by higher interest rates in recent years.
- Commission, fee, and other income: approximately 3% to 8% of total revenue. This can include ceding commissions, service-related fees, and other operating items tied to insurance activities.
Over the last several years, the business has expanded meaningfully, with revenue rising from roughly $536 million in 2021 to more than $1.4 billion in 2025, while net income also increased strongly. That combination suggests the company has not just grown volume, but has also improved its ability to turn premiums into profit.
The operating picture shows a business that has grown much faster than its cost base over time. Revenue and operating income have both moved up sharply since 2021, and net income has followed, which is an encouraging sign in an industry where rapid growth can sometimes come at the cost of underwriting discipline.
Key Figures
| Metric | Value | Sector ⓘ |
|---|---|---|
| Date | Oct 24, 2026 | |
| Context | ||
| Sector | Financial Services | |
| Industry | Insurance - Property & Casualty | |
| Market Cap ⓘ | $2.76B | |
| Beta ⓘ | 0.35 | |
Value (Cheapness) | ||
| P/E Ratio ⓘ | 14.22 | 12.46 |
| P/B Ratio ⓘ | 2.05 | 1.25 |
| FCF Yield ⓘ | 14.65% | 9.82% |
| Dividend Yield ⓘ | N/A | 2.94% |
| EBIT / EV ⓘ | 9.86% | 8.11% |
| PEG ⓘ | 0.72 | |
Growth (Business expansion) | ||
| Revenue Growth ⓘ | 53.00% | 9.10% |
| RPS Growth (5Y CAGR) ⓘ | 19.60% | 12.31% |
| EPS Growth (5Y CAGR) ⓘ | 41.73% | -6.97% |
| BVPS Growth (5Y CAGR) ⓘ | 16.42% | 5.02% |
| Margin Growth (5Y Trend) ⓘ | 5.99% | -4.00% |
| FCF Growth (5Y CAGR) ⓘ | 23.49% | 4.71% |
| DPS Growth (5Y CAGR) ⓘ | N/A | 8.92% |
Quality (Business durability) | ||
| ROIC (Latest) ⓘ | 14.51% | 9.18% |
| ROE (Latest) ⓘ | 16.86% | 13.93% |
| ROA (Latest) ⓘ | 3.30% | 1.57% |
| ROIC (5Y Median) ⓘ | 14.41% | 7.80% |
| ROE (5Y Median) ⓘ | 15.88% | 12.15% |
| ROA (5Y Median) ⓘ | 3.23% | 1.28% |
| Net Debt / EBIT (Latest) ⓘ | 0.83 | 1.02 |
| Net Debt / EBIT (5Y Median) ⓘ | 0.52 | 0.72 |
| Net Debt / EBITDA (Latest) ⓘ | 0.78 | 0.88 |
| Operating Margin (Latest) ⓘ | 15.94% | 22.30% |
| Operating Margin (5Y Median) ⓘ | 13.42% | 24.50% |
| Debt to Equity (Latest) ⓘ | 34.49% | 59.34% |
| Profit Margin (Latest) ⓘ | 10.84% | 26.42% |
| Free Cash Flow (Latest) ⓘ | $404.17M | |
Momentum (Price trend) | ||
| 3Y Return ⓘ | +127.36% | +95.73% |
| 12M Return (excl. last month) ⓘ | +18.33% | +17.30% |
| 6M Return ⓘ | +34.52% | +6.07% |
| Price vs. 200-Day MA ⓘ | +21.40% | +5.36% |
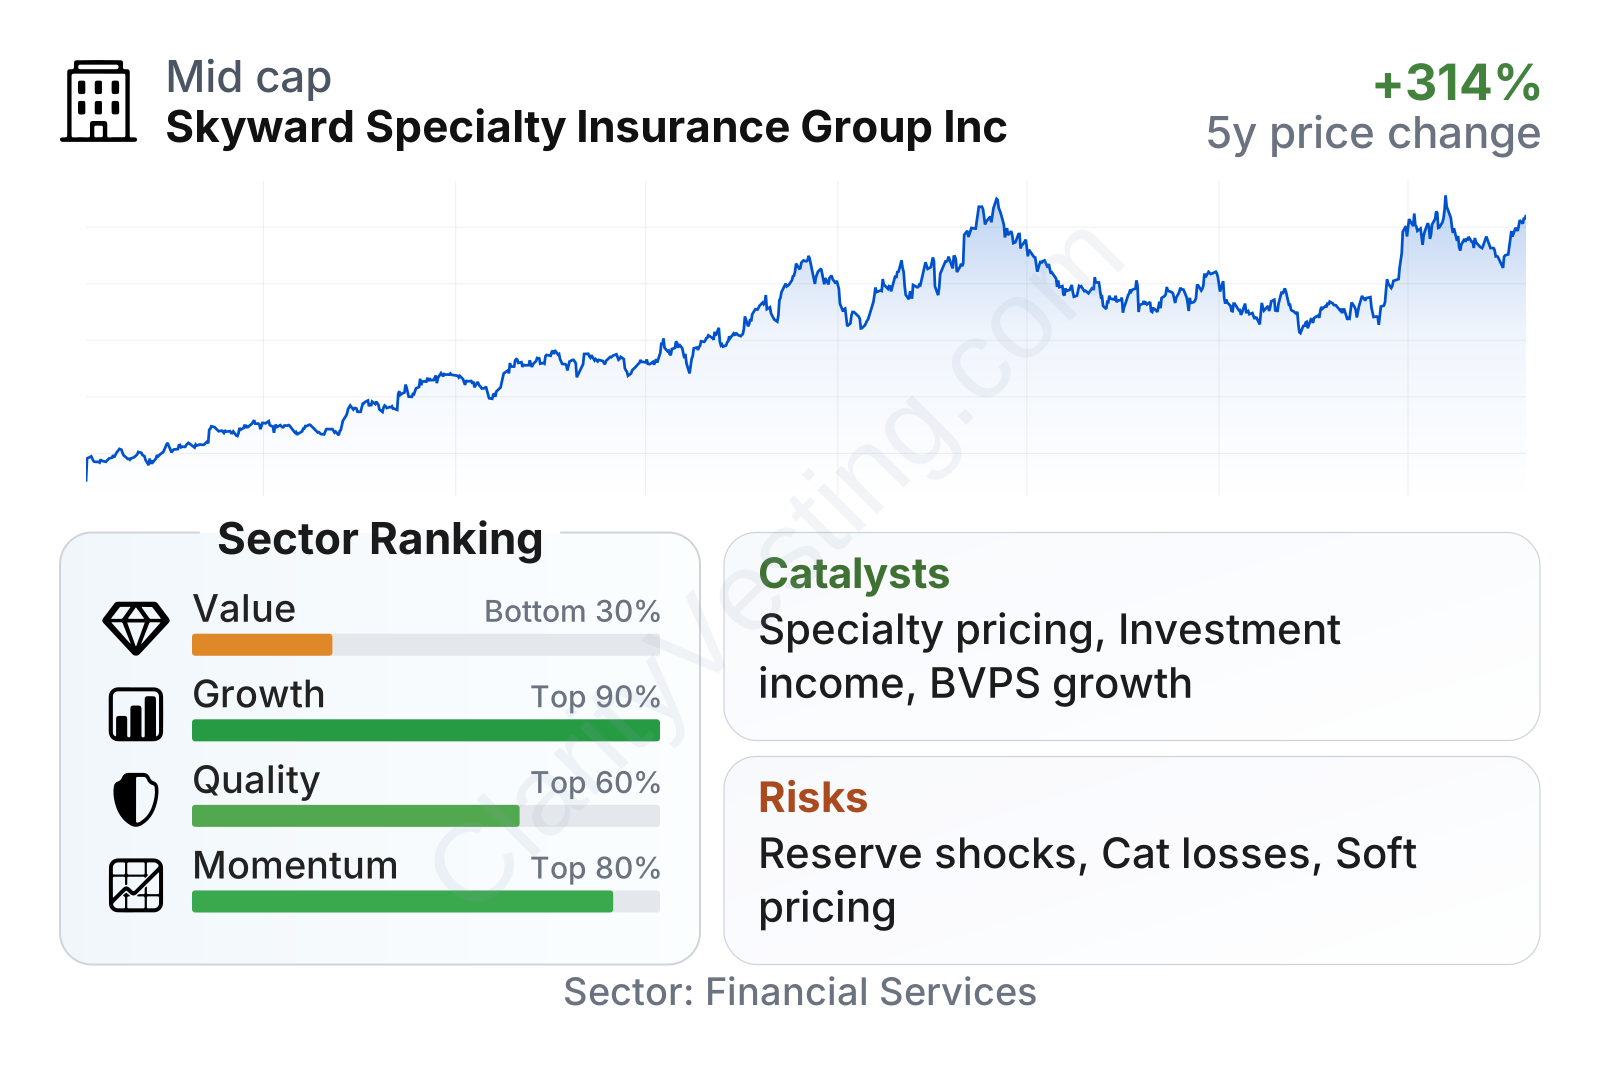
Skyward Specialty stands out most on growth, where it ranks near the top of its sector. Revenue growth, earnings growth, and book value growth are all well ahead of typical peers. Profitability is also solid, with returns on equity and assets above sector medians, while leverage remains moderate for an insurer. On valuation, the picture is more mixed: the earnings multiple is close to the sector median, but the price-to-book ratio is higher, suggesting the market gives the company credit for better growth and underwriting quality. The stock’s beta is low, which indicates trading has been less volatile than the broader market.
The share price trend since the 2023 listing has been broadly positive, though not perfectly smooth. After a strong run through 2024 and part of 2025, the stock experienced a pullback and then recovered to new highs in 2026. That pattern fits a company whose market perception has improved alongside earnings and book value growth.
Growth
Specialty property and casualty insurance is generally viewed as an attractive part of the insurance market because complex risks tend to support better pricing than more commoditized lines. Many businesses need tailored coverage, and that creates room for underwriters with niche expertise. This does not make the sector risk-free, but it does mean growth can be more durable when the company is disciplined about where it writes business.
Skyward Specialty’s strategy appears coherent for long-term expansion. Rather than competing primarily on scale in mainstream insurance, it concentrates on selected specialty lines where underwriting judgment, broker relationships, and product design can create differentiation. That approach has helped the company grow premiums while maintaining profitability metrics that compare favorably with many peers. It also gives management more flexibility to pull back from unattractive markets and redirect capital to lines with better pricing.
Earnings per share have risen sharply from 2022 through 2025, pointing to more than just premium growth. The increase suggests the company has been converting expansion into actual shareholder earnings, which is more meaningful than top-line growth alone in insurance.
Book value per share has also climbed strongly after the disruption around the IPO period. For insurers, book value is a particularly useful measure because it reflects the capital base supporting underwriting. Sustained growth here usually signals that profits are being retained and compounded rather than offset by weak reserve development or excess dilution.
Recent company communications have highlighted ongoing premium growth, favorable underwriting conditions in several specialty markets, and continued contribution from investment income. Higher reinvestment yields have been an important tailwind across the industry, and Skyward Specialty has been benefiting from that as older lower-yield bonds roll off and new funds are invested at more attractive rates.
A notable catalyst is the company’s ability to keep scaling in niche lines without needing to become one of the industry giants. In specialty insurance, smaller focused operators can still perform very well if they have strong underwriting teams and maintain pricing discipline. Another important catalyst is capital compounding: if the company continues to grow book value at a healthy rate, it expands the amount of business it can support over time.
Risks
This article is for informational purposes only and does not constitute financial advice. Some content is AI-generated. See Disclaimer


