Stock Analysis · Tanger Factory Outlet Centers Inc (SKT)
Overview
Tanger Factory Outlet Centers Inc is a retail real estate investment trust, or REIT. In simple terms, it owns, operates, and develops open-air shopping centers, with a historic focus on outlet centers and a growing presence in broader value-oriented retail destinations. The company makes money mainly by leasing space to tenants such as apparel brands, footwear companies, home goods retailers, restaurants, and entertainment operators. Because it is a REIT, the business is built around collecting recurring rental income rather than manufacturing products or selling goods directly to consumers.
Tanger’s portfolio is concentrated in the United States and Canada, and its properties are designed to attract shoppers looking for branded merchandise at discount prices. In recent years, the company has also leaned more into mixed-use and everyday retail elements to keep its centers relevant as shopping habits change. That matters for long-term analysis because outlet real estate is more resilient when it functions not only as a bargain-shopping destination, but also as a convenient place for dining, entertainment, and routine consumer trips.
The company’s revenue mix is still dominated by property-level rental income. Based on recent annual filings and the usual structure of outlet REIT reporting, the main sources are approximately:
- Base rent and fixed lease revenue: about 70% to 75% — recurring rent paid by tenants for store space.
- Recoveries, reimbursements, and other tenant charges: about 15% to 20% — payments from tenants covering common area maintenance, taxes, insurance, utilities, and related property operating costs.
- Percentage rent, parking, advertising, and other property income: about 5% to 10% — variable rent tied to tenant sales in some leases, plus ancillary income streams.
- Management, lease termination fees, and other miscellaneous income: usually less than 5% — smaller and less predictable items.
Over the last several years, revenue, operating income, and net income have all moved higher, showing a business that has been recovering from the post-pandemic period and improving asset productivity. Costs have risen too, but revenue growth has outpaced that pressure, allowing profitability to expand.
The multi-year flow of revenue and expenses points to a healthier earnings structure than a few years ago. Sales have climbed from the low-$400 million range to above $580 million, while operating income and net income have improved more quickly, suggesting better occupancy, stronger leasing spreads, and firmer expense absorption at the property level.
Key Figures
| Metric | Value | Sector ⓘ |
|---|---|---|
| Date | Oct 17, 2026 | |
| Context | ||
| Sector | Real Estate | |
| Industry | REIT - Retail | |
| Market Cap ⓘ | $4.10B | |
| Beta ⓘ | 1.10 | |
Value (Cheapness) | ||
| P/E Ratio ⓘ | 31.50 | 17.38 |
| P/B Ratio ⓘ | 6.32 | 0.85 |
| FCF Yield ⓘ | 5.26% | 7.38% |
| Dividend Yield ⓘ | 3.49% | 4.85% |
| EBIT / EV ⓘ | 3.43% | 3.78% |
| PEG ⓘ | 4.14 | |
Growth (Business expansion) | ||
| Revenue Growth ⓘ | 11.50% | 5.30% |
| RPS Growth (5Y CAGR) ⓘ | 4.96% | 6.02% |
| EPS Growth (5Y CAGR) ⓘ | 3.63% | -11.37% |
| BVPS Growth (5Y CAGR) ⓘ | 4.82% | 0.45% |
| Margin Growth (5Y Trend) ⓘ | 17.24% | -0.22% |
| FCF Growth (5Y CAGR) ⓘ | 7.92% | 5.40% |
| DPS Growth (5Y CAGR) ⓘ | 12.90% | 5.02% |
Quality (Business durability) | ||
| ROIC (Latest) ⓘ | 7.17% | 5.69% |
| ROE (Latest) ⓘ | 19.35% | 7.56% |
| ROA (Latest) ⓘ | 4.67% | 2.85% |
| ROIC (5Y Median) ⓘ | 3.10% | 4.22% |
| ROE (5Y Median) ⓘ | 16.73% | 6.03% |
| ROA (5Y Median) ⓘ | 4.19% | 2.44% |
| Net Debt / EBIT (Latest) ⓘ | 8.39 | 7.59 |
| Net Debt / EBIT (5Y Median) ⓘ | 9.82 | 8.40 |
| Net Debt / EBITDA (Latest) ⓘ | 4.68 | 5.27 |
| Net Debt / Assets ⓘ | 58.89% | 37.76% |
| EBITDA / Interest ⓘ | 4.99 | 4.10 |
| Operating Margin (Latest) ⓘ | 32.77% | 35.29% |
| Operating Margin (5Y Median) ⓘ | 31.06% | 37.31% |
| Debt to Equity (Latest) ⓘ | 276.12% | 88.87% |
| Profit Margin (Latest) ⓘ | 20.23% | 19.61% |
| Free Cash Flow (Latest) ⓘ | $215.86M | |
Momentum (Price trend) | ||
| 3Y Return ⓘ | +68.47% | +30.75% |
| 12M Return (excl. last month) ⓘ | +10.86% | +4.36% |
| 6M Return ⓘ | -0.92% | -2.52% |
| Price vs. 200-Day MA ⓘ | -2.46% | -2.34% |
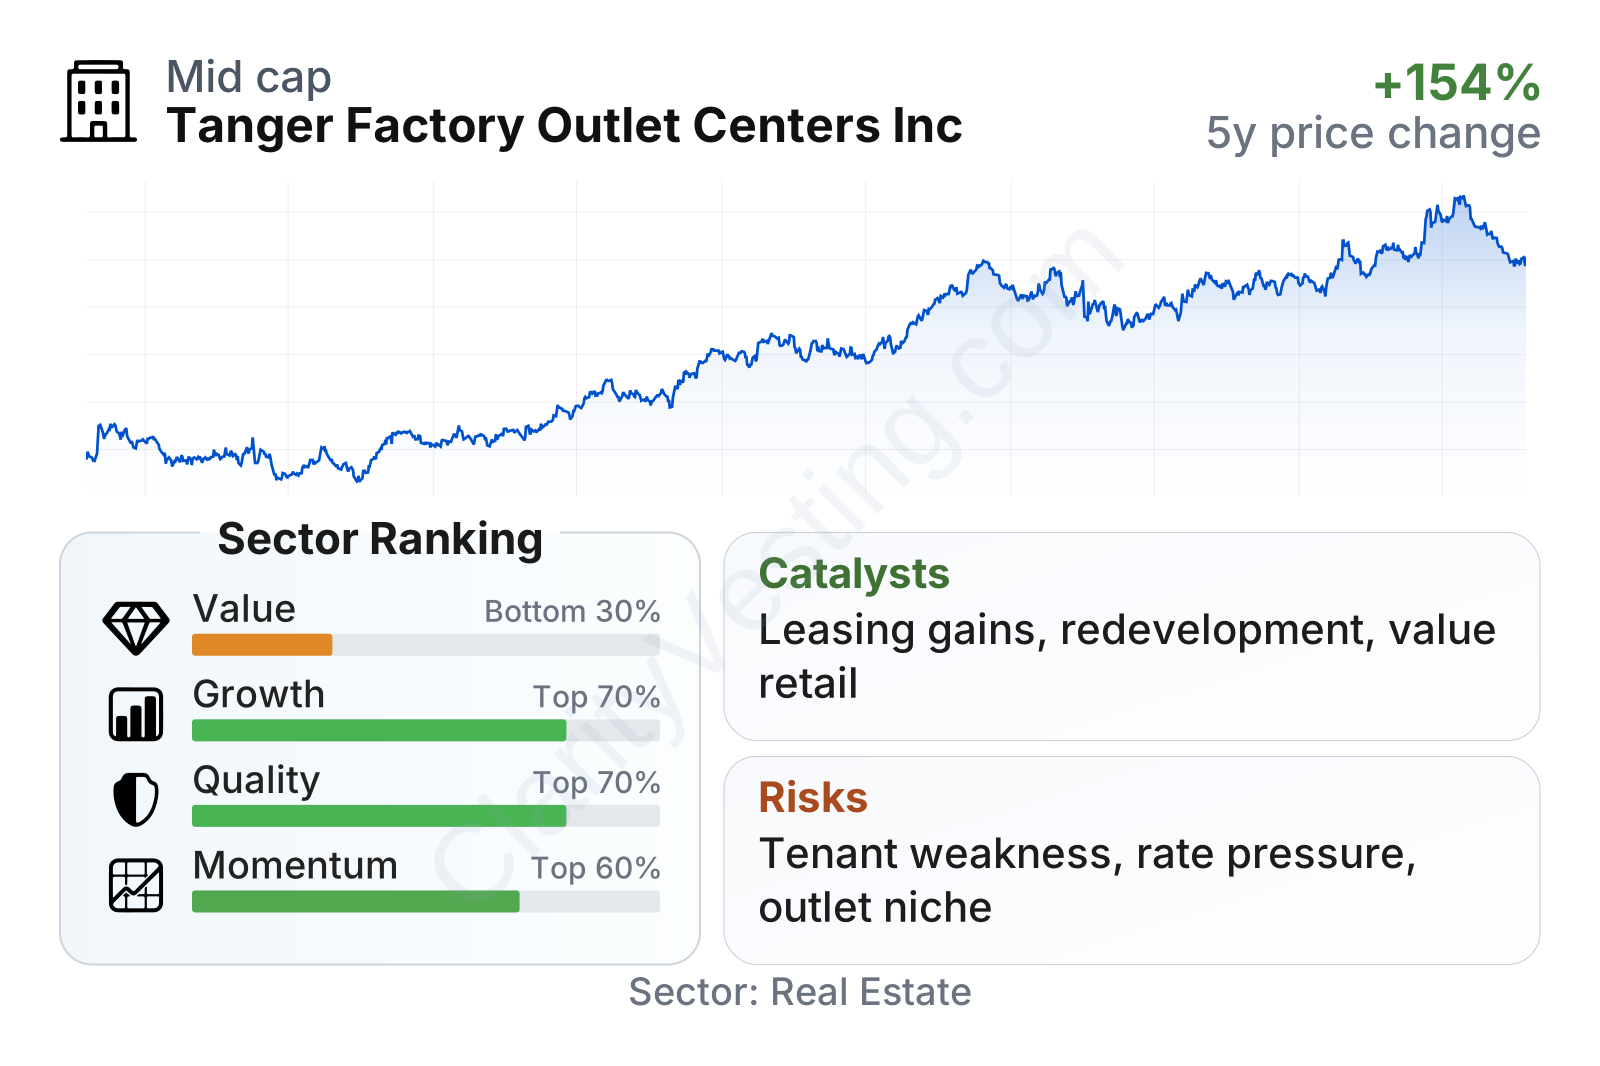
Tanger is a mid-sized public REIT with share-price volatility close to the broader market. The overall profile is mixed in a useful way: growth and quality rank better than much of the real estate sector, while valuation screens as weaker because the stock trades at noticeably higher earnings and book multiples than the sector median. Free cash flow generation remains solid, but the cash yield and dividend yield are not especially high relative to peers.
The stock’s longer-term market performance has been strong, with a large rise from 2022 levels through mid-2026. That appreciation reflects improving operations, but it also means part of the operational progress is already recognized in the current price.
Growth
Tanger operates in a retail real estate niche that is no longer a rapid expansion industry, but it is also far from obsolete. Open-air centers have generally held up better than enclosed malls because they are easier to access, cost less to operate, and fit consumer preference for convenience. Outlet centers add another layer of relevance when households are focused on value. That makes Tanger’s segment more tied to practical shopping behavior than to purely discretionary luxury spending.
The company’s strategy appears sensible for future growth. Management has focused on keeping occupancy high, refreshing the tenant mix, redeveloping existing sites, and selectively adding centers that broaden its appeal beyond traditional outlet shopping. The goal is not explosive expansion, but steady cash-flow growth from properties that can support rent increases, stronger traffic, and higher tenant sales productivity.
Revenue per share has risen consistently since 2021, moving from a little above $4 to above $5 by 2025. That is an encouraging sign because it shows growth on a per-share basis, not just growth from adding more capital. It suggests the portfolio itself has been generating more income and that dilution has not overwhelmed operating progress.
Dividend per share has also increased steadily over the same period. For a REIT, that is an important signal: it indicates management has had enough confidence in recurring cash flow to raise distributions while still investing in the portfolio and managing debt. Even though the current dividend yield is below the sector median, the growth rate of the dividend has been notably stronger than many peers.
There are also a few practical catalysts supporting the business. First, value-oriented retail can benefit when consumers become more price conscious. Second, Tanger still has room to create growth through leasing vacant space, renewing leases at better terms, and adding nontraditional tenants such as food, entertainment, and services. Third, its operating margin trend over five years has improved sharply relative to much of the sector, which suggests execution has become more disciplined.
Recent company updates have also pointed to continued leasing activity, healthy occupancy, and ongoing capital allocation toward redevelopment and selective acquisitions. None of these alone changes the company overnight, but together they support a credible path of incremental growth rather than stagnation.
Risks
This article is for informational purposes only and does not constitute financial advice. Some content is AI-generated. See Disclaimer


