Stock Analysis · Sherwin-Williams Co (SHW)
Overview
Sherwin-Williams is one of the largest paint and coatings companies in the world. It makes products used to decorate, protect, and maintain buildings, industrial equipment, packaging, transportation assets, and infrastructure. Its brands are sold through company-operated paint stores, third-party retailers, and direct relationships with industrial customers.
The business is organized into three main segments, with revenue concentrated in architectural paint sold in North America. Based on the latest annual company disclosures, the revenue mix is approximately:
- The Americas Group: about 57% of revenue. This is the largest segment and includes architectural paint, stains, supplies, and related products sold primarily through Sherwin-Williams stores in the U.S., Canada, and Latin America to professional painters, contractors, property managers, and homeowners.
- Consumer Brands Group: about 17% of revenue. This segment supplies branded and private-label paint and related products to retail chains, dealers, hardware stores, mass merchandisers, and e-commerce channels.
- Performance Coatings Group: about 26% of revenue. This includes industrial coatings for packaging, automotive and transportation, coil, wood, protective and marine, and general industrial uses.
That mix matters because it gives the company a balance between renovation-driven paint demand and more cyclical industrial end markets. It also gives Sherwin-Williams unusual control over distribution through its own store network, which is a major difference versus many coatings peers that rely more heavily on third-party retail channels.
Over the last several years, revenue has grown from roughly $19.9 billion in 2021 to about $23.6 billion in 2025. Gross profit has expanded faster than sales, helped by pricing, mix, and easing raw-material pressure after the inflation spike of 2022. Net income has also risen meaningfully versus 2021, although 2025 showed a small pullback from 2024.
The cost structure shows a business with improving gross profit over time, but also one that spends heavily on selling and distribution to support its large store base. That expense burden is not a weakness by itself: it is part of the model that helps Sherwin-Williams stay close to professional customers and protect pricing.
Key Figures
| Metric | Value | Sector ⓘ |
|---|---|---|
| Date | Oct 03, 2026 | |
| Context | ||
| Sector | Basic Materials | |
| Industry | Specialty Chemicals | |
| Market Cap ⓘ | $80.22B | |
| Beta ⓘ | 1.09 | |
Value (Cheapness) | ||
| P/E Ratio ⓘ | 30.68 | 17.61 |
| P/B Ratio ⓘ | 20.72 | 1.77 |
| FCF Yield ⓘ | 4.01% | 5.87% |
| Dividend Yield ⓘ | 0.96% | 2.06% |
| EBIT / EV ⓘ | 4.30% | 6.43% |
| PEG ⓘ | 2.10 | |
Growth (Business expansion) | ||
| Revenue Growth ⓘ | 7.50% | 11.30% |
| RPS Growth (5Y CAGR) ⓘ | 6.14% | 4.46% |
| EPS Growth (5Y CAGR) ⓘ | -9.35% | -13.11% |
| BVPS Growth (5Y CAGR) ⓘ | 19.30% | 5.51% |
| Margin Growth (5Y Trend) ⓘ | 3.20% | -1.57% |
| FCF Growth (5Y CAGR) ⓘ | 9.11% | 0.55% |
| DPS Growth (5Y CAGR) ⓘ | 9.62% | 6.02% |
Quality (Business durability) | ||
| ROIC (Latest) ⓘ | 19.44% | 9.31% |
| ROA (Latest) ⓘ | 10.11% | 4.94% |
| ROIC (5Y Median) ⓘ | 21.84% | 7.91% |
| ROA (5Y Median) ⓘ | 10.37% | 3.93% |
| Net Debt / EBIT (Latest) ⓘ | 3.47 | 1.40 |
| Net Debt / EBIT (5Y Median) ⓘ | 3.35 | 1.70 |
| Net Debt / EBITDA (Latest) ⓘ | 3.12 | 0.91 |
| Net Debt / Assets ⓘ | 51.66% | 13.69% |
| EBITDA / Interest ⓘ | 8.64 | 11.93 |
| Operating Margin (Latest) ⓘ | 16.42% | 13.07% |
| Operating Margin (5Y Median) ⓘ | 16.02% | 11.86% |
| Debt to Equity (Latest) ⓘ | 368.78% | 40.43% |
| Profit Margin (Latest) ⓘ | 11.01% | 6.57% |
| Free Cash Flow (Latest) ⓘ | $3.21B | |
Momentum (Price trend) | ||
| 3Y Return ⓘ | +30.17% | +65.06% |
| 12M Return (excl. last month) ⓘ | -6.51% | +36.05% |
| 6M Return ⓘ | +1.34% | +1.89% |
| Price vs. 200-Day MA ⓘ | -2.63% | +1.03% |
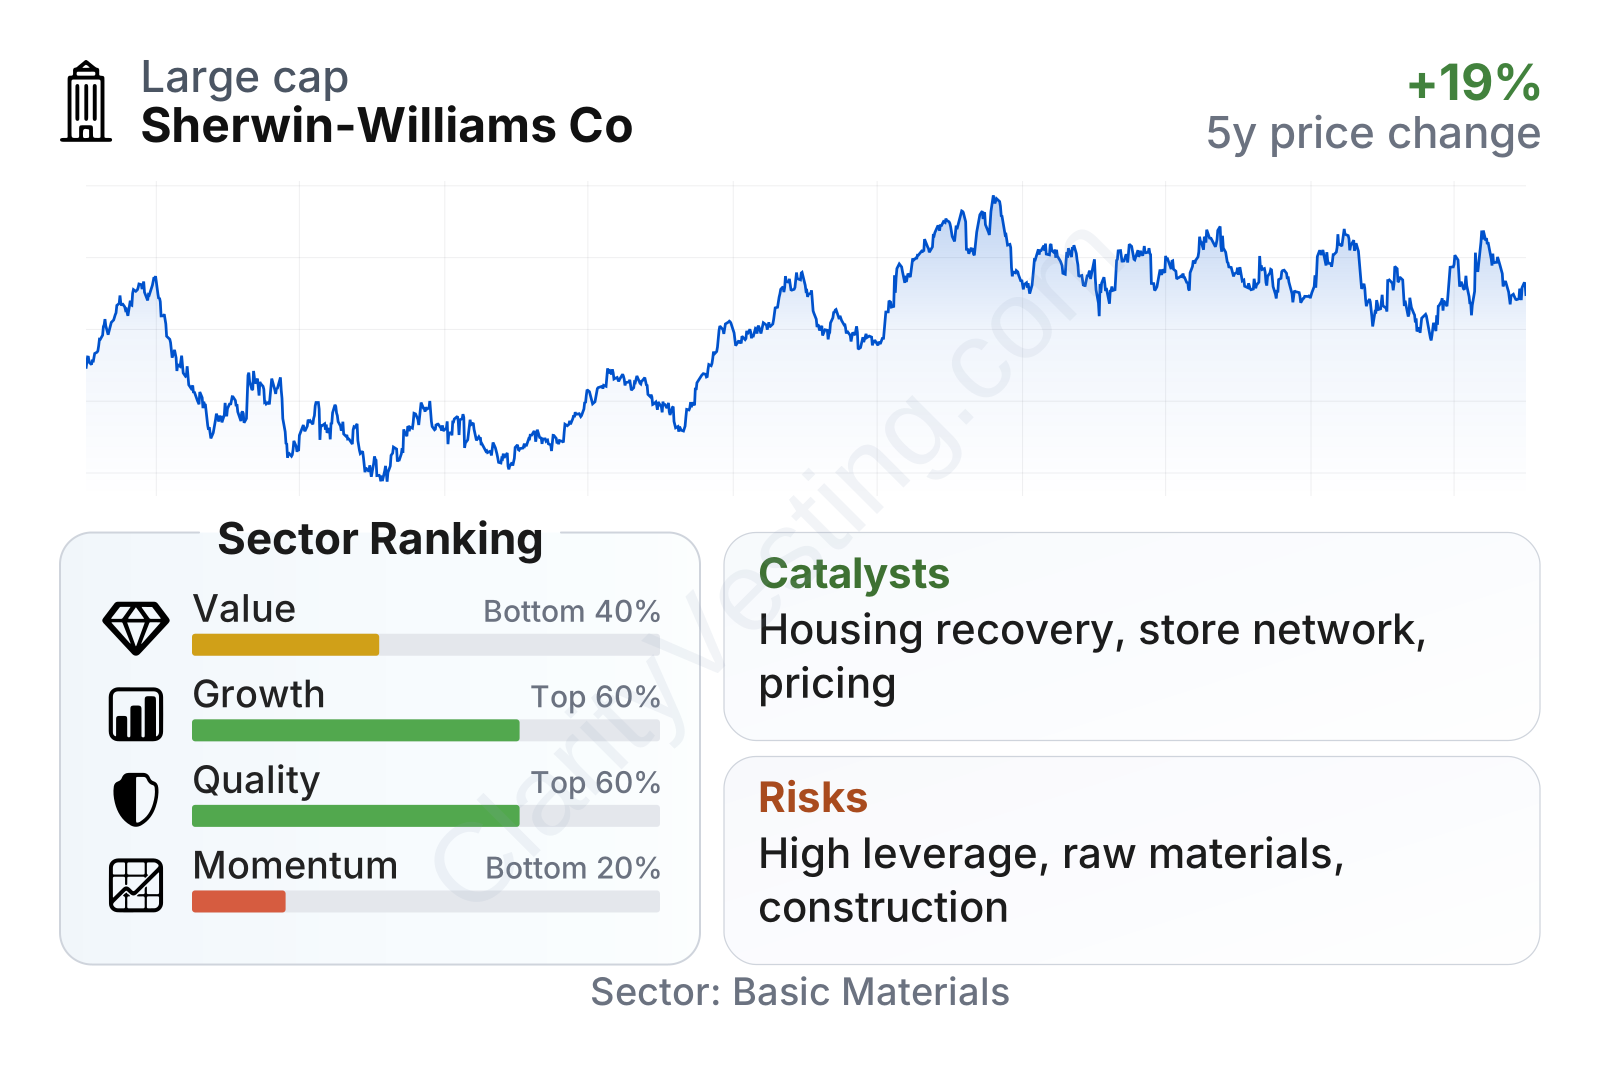
Sherwin-Williams stands out for business quality more than for cheapness. Profitability and returns on capital are comfortably above much of the sector, while free cash flow generation is strong for a company of its size. Growth metrics are decent rather than exceptional, and recent share-price momentum has been soft. The main tension in the profile is clear: the company looks operationally strong, but valuation measures sit in the less attractive part of the sector.
The stock has been volatile over the last few years, with a sharp drop in 2022, a strong rebound through 2024, and a flatter pattern more recently. That fits the broader picture of a high-quality industrial and building-products business whose market value tends to move not only with earnings, but also with expectations for housing, renovation, and manufacturing demand.
Growth
Paint and coatings is not a fast-changing technology market, but it is a large, durable, and steadily expanding industry tied to construction, repainting, maintenance, and industrial production. Over long periods, demand tends to benefit from population growth, housing turnover, aging buildings, infrastructure work, and stricter product-performance requirements. A key attraction here is that repaint and maintenance demand is usually more resilient than new construction demand.
Sherwin-Williams has several growth levers that make strategic sense. Its company-owned store network gives it direct access to professional painters, one of the most valuable customer groups in architectural coatings. That relationship can support repeat purchases, service differentiation, and pricing discipline. In industrial coatings, the company can also grow by widening product penetration in areas such as protective coatings, packaging, and transportation.
Recent sales growth shows a business that slowed materially after the post-inflation pricing surge, then began to reaccelerate. The latest year-over-year trend is back in the high-single-digit range, which is healthier than the near-flat readings seen in parts of 2023 and 2024. That suggests demand and pricing are still working together, even if growth remains below some faster-moving parts of the materials sector.
Cash generation has improved meaningfully, with trailing free cash flow now near the upper end of the company’s recent range and above where it stood a few years ago. This matters because free cash flow funds dividends, debt reduction, store investments, and acquisitions without relying entirely on external financing.
One notable catalyst is the longer-term recovery potential in residential repainting and new housing activity if interest-rate pressure eases. Sherwin-Williams is especially exposed to professional architectural demand, so even a moderate improvement in project activity can matter. Another opportunity comes from its premium brands and product innovation in areas such as durability, application efficiency, and specialty coatings, which can support mix and margins rather than just volume.
Recent company communications have also pointed to continued investment in stores, productivity, and customer-facing service. That does not create overnight growth, but it reinforces a model built around market-share gains and steady compounding rather than one-off jumps.
Risks
This article is for informational purposes only and does not constitute financial advice. Some content is AI-generated. See Disclaimer


