Stock Analysis · Sihuan Pharmaceutical Holdings Group Ltd (SHPHF)
Overview
Sihuan Pharmaceutical Holdings Group Ltd is a China-based healthcare company focused on pharmaceuticals, medical aesthetics, and broader medical health products. The group historically built its business in branded generic drugs, especially in cardiovascular and cerebrovascular treatments, and in recent years it has been expanding into medical aesthetics, oncology, diabetes, and other higher-growth therapeutic and consumer-facing healthcare segments.
The business has become more diversified than it was a few years ago. Based on the company’s annual reporting and business updates, revenue comes mainly from pharmaceutical products, with newer contributions from medical aesthetics and other healthcare products and services. Exact category splits can vary by reporting period, but the structure can be summarized as follows:
- Pharmaceutical products: still the largest source of revenue, estimated at roughly 70% to 85% of group sales in recent periods. This includes prescription drugs, branded generics, and products in areas such as cardio-cerebrovascular disease, oncology, diabetes, and anti-infectives.
- Medical aesthetics: estimated at roughly 10% to 20%. This includes injectables, regenerative products, and other aesthetic medicine offerings sold through clinics and healthcare channels.
- Other medical health businesses: estimated at roughly 5% to 15%. This includes medical devices, consumer healthcare, and platform-related activities that support the company’s broader healthcare ecosystem.
What stands out is the transition under way: the company is trying to reduce dependence on older hospital-driven drug categories and build a wider portfolio with more self-funded innovation and higher-value specialty products. That shift matters because traditional generic-drug pricing in China has been under pressure for years, while aesthetics and specialty therapies can offer better growth if execution is strong.
From a financial flow perspective, the business remains gross-margin rich, which is common in branded pharmaceuticals, but profitability has been uneven. Revenue declined sharply after 2021, then stabilized, and 2025 showed a notable rebound. Research and development spending was very heavy in 2022 and has since moderated, while selling expenses rose again in 2024 before easing relative to revenue in 2025. That pattern suggests a company still investing for repositioning rather than one operating in a settled, mature state.
The multi-year picture shows a business that kept a high gross profit base even during the downturn, but swings in research spending, selling costs, and impairment-related pressure made earnings volatile. The 2025 recovery is important because it points to improving operating balance, though it does not yet erase the uneven record of the prior years.
Key Figures
| Metric | Value | Sector ⓘ |
|---|---|---|
| Date | Oct 03, 2026 | |
| Context | ||
| Sector | Healthcare | |
| Industry | Drug Manufacturers - Specialty & Generic | |
| Market Cap ⓘ | $1.92B | |
| Beta ⓘ | 0.88 | |
Value (Cheapness) | ||
| P/E Ratio ⓘ | N/A | 24.06 |
| P/B Ratio ⓘ | 0.18 | 3.08 |
| FCF Yield ⓘ | -14.49% | 3.07% |
| Dividend Yield ⓘ | 5.88% | 2.05% |
| EBIT / EV ⓘ | N/A | 0.63% |
| PEG ⓘ | N/A | |
Growth (Business expansion) | ||
| Revenue Growth ⓘ | 1.30% | 7.50% |
| RPS Growth (5Y CAGR) ⓘ | -3.36% | 8.70% |
| EPS Growth (5Y CAGR) ⓘ | -37.16% | -18.20% |
| BVPS Growth (5Y CAGR) ⓘ | -11.91% | 3.95% |
| Margin Growth (5Y Trend) ⓘ | -7.26% | -0.58% |
| FCF Growth (5Y CAGR) ⓘ | N/A | 0.88% |
| DPS Growth (5Y CAGR) ⓘ | -6.37% | 6.80% |
Quality (Business durability) | ||
| ROIC (Latest) ⓘ | N/A | 3.29% |
| ROA (Latest) ⓘ | 4.08% | 3.02% |
| ROIC (5Y Median) ⓘ | 1.45% | 4.75% |
| ROA (5Y Median) ⓘ | -0.46% | 1.93% |
| Net Debt / EBIT (Latest) ⓘ | -3.00 | 1.33 |
| Net Debt / EBIT (5Y Median) ⓘ | -6.80 | 1.83 |
| Net Debt / EBITDA (Latest) ⓘ | -2.07 | 0.99 |
| Net Debt / Assets ⓘ | -19.36% | 5.33% |
| EBITDA / Interest ⓘ | N/A | 9.63 |
| Operating Margin (Latest) ⓘ | 17.38% | 9.25% |
| Operating Margin (5Y Median) ⓘ | 5.81% | 7.80% |
| Debt to Equity (Latest) ⓘ | 15.76% | 28.99% |
| Profit Margin (Latest) ⓘ | 11.46% | 3.60% |
| Free Cash Flow (Latest) ⓘ | -$277.70M | |
Momentum (Price trend) | ||
| 3Y Return ⓘ | +60.43% | +37.48% |
| 12M Return (excl. last month) ⓘ | +20.85% | +20.85% |
| 6M Return ⓘ | -35.66% | +9.73% |
| Price vs. 200-Day MA ⓘ | +42.41% | +4.69% |
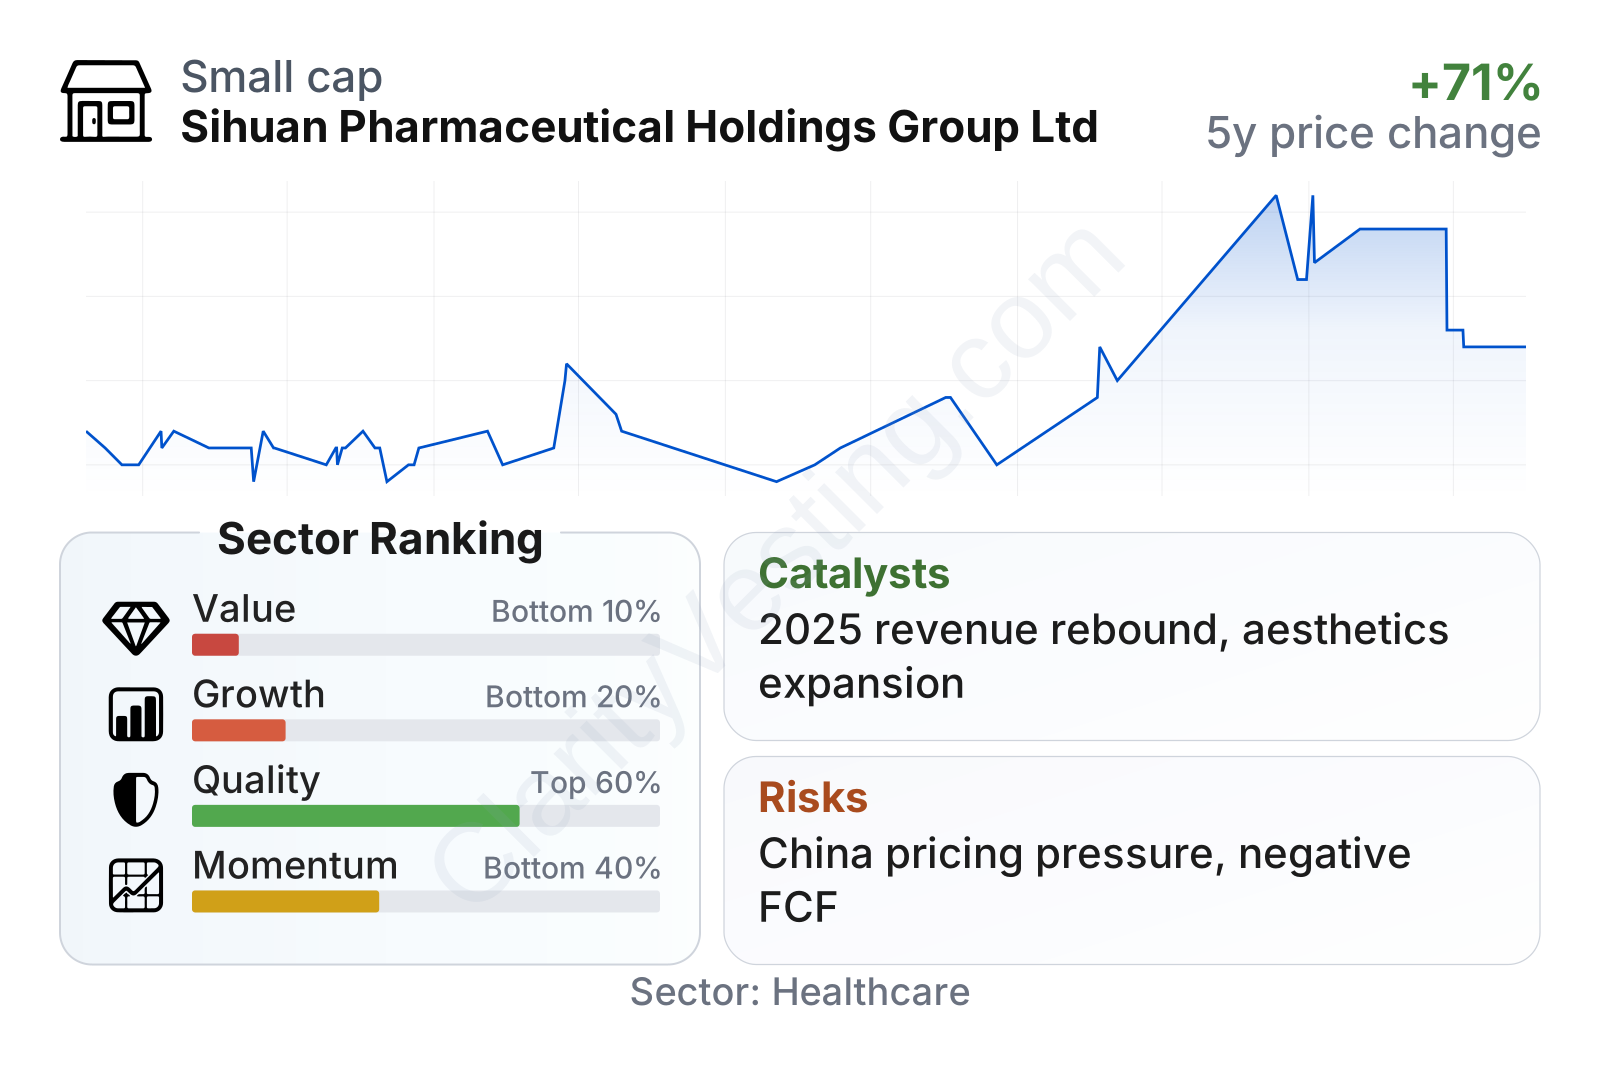
The stock has delivered a positive three-year return overall, but the path has been volatile, including a weak recent six-month stretch. In the factor breakdown, valuation screens as very low versus the healthcare sector, largely because the shares trade at a small fraction of book value and offer a dividend yield well above the sector median. That said, the cheap appearance is tied to a mixed operating record, including negative free cash flow and weak long-term growth metrics.
Quality is more balanced than the headline volatility might suggest. Recent profitability margins are above sector medians, and the balance sheet looks conservative, with net cash rather than heavy net debt and debt-to-equity around 16%, below the sector median. The main tension is that near-term profitability and balance-sheet strength look better than the longer-term growth record, where revenue per share, earnings, and book value trends have lagged badly.
Growth
Sihuan operates in parts of healthcare that are still attractive over a long horizon, but not all of them are equally favorable. China’s pharmaceutical market remains large and supported by aging demographics, rising chronic disease prevalence, and continued demand for oncology, diabetes, and specialty care. Medical aesthetics is also a structural growth area, supported by consumer demand and product innovation, although it is more competitive and sensitive to regulation and consumer confidence.
The company’s strategy broadly makes sense in that context. Moving beyond legacy cardiovascular products toward oncology, diabetes, aesthetics, and a larger innovation pipeline is a rational response to pricing pressure in traditional generics. Internal research capabilities and a broader product platform can help if commercialization improves and new approvals continue. The challenge is not the direction of the strategy; it is execution. Over the past several years, the company has had to absorb revenue pressure, heavy research spending, and profitability swings while trying to build new growth engines.
There are still visible catalysts. The return to revenue growth in 2025, at about 34% versus 2024 based on the annual figures shown here, is a meaningful operational improvement after several difficult years. Gross profit also recovered strongly, and operating income turned positive again. That suggests the newer portfolio and cost structure may be gaining traction. If the company can sustain expansion in medical aesthetics and specialty drugs while keeping research and selling costs more controlled than in 2022 and 2024, growth quality could improve materially.
Another supportive element is financial flexibility. With net cash metrics stronger than many peers, Sihuan has room to keep funding product development, licensing, and commercialization without looking overleveraged. In healthcare, that matters because product cycles are long and setbacks are common. A stronger balance sheet does not create growth by itself, but it can give management time to execute a transition.
Risks
This article is for informational purposes only and does not constitute financial advice. Some content is AI-generated. See Disclaimer


