Stock Analysis · Schroders PLC (SHNWF)
Overview
Schroders PLC is a U.K.-based asset manager. In simple terms, it manages money on behalf of other people and institutions, including pension funds, insurers, governments, charities, wealthy individuals, and retail savers. The firm offers traditional investment funds, private market strategies, wealth management, and specialist solutions such as infrastructure, real estate, and alternative assets. Its business model is straightforward: it earns fees for managing client assets, and those fees usually rise when assets under management increase through market gains, new client money, or acquisitions.
Schroders’ revenue mix is driven mainly by recurring management fees, with performance fees and other income playing a smaller role. Based on recent annual reporting and segment disclosures, the business can be understood through these main sources:
- Asset management fees: approximately 75% to 85% of revenue. This is the core activity and includes fees earned from mutual funds, institutional mandates, and investment strategies across equities, fixed income, multi-asset, and private markets.
- Wealth management and advisory income: approximately 10% to 20% of revenue. This includes services for high-net-worth clients and advisory-led offerings, helped by Schroders’ wealth platforms and planning capabilities.
- Performance fees and carried interest: approximately 3% to 8% of revenue, depending on market conditions and realization timing. This income can be volatile from year to year.
- Other income: usually a small residual share, including administration, servicing, and investment-related items.
Schroders is not the largest global asset manager, but it is a sizable and well-established player with a broad international footprint. The company’s appeal rests on diversification across client types and asset classes, especially its push into private assets and wealth management, where fee rates can be higher than in plain-vanilla public market products.
The broad financial flow shows a business with fairly stable revenue over the last several years and a noticeable recovery in 2025 after a softer 2023 and 2024 period. Profitability has been positive throughout, but margins have not been consistently expanding, which matters for a fee-based company facing pricing pressure and market swings.
Key Figures
| Metric | Value | Sector ⓘ |
|---|---|---|
| Date | Oct 03, 2026 | |
| Context | ||
| Sector | Financial Services | |
| Industry | Asset Management | |
| Market Cap ⓘ | $12.37B | |
| Beta ⓘ | 1.08 | |
Value (Cheapness) | ||
| P/E Ratio ⓘ | 13.67 | 12.60 |
| P/B Ratio ⓘ | 3.75 | 1.23 |
| FCF Yield ⓘ | 15.79% | 10.16% |
| Dividend Yield ⓘ | 2.77% | 2.96% |
| EBIT / EV ⓘ | N/A | 7.77% |
| PEG ⓘ | 1.27 | |
Growth (Business expansion) | ||
| Revenue Growth ⓘ | 15.60% | 9.50% |
| RPS Growth (5Y CAGR) ⓘ | -4.68% | 12.10% |
| EPS Growth (5Y CAGR) ⓘ | -39.08% | -9.45% |
| BVPS Growth (5Y CAGR) ⓘ | -5.52% | 5.01% |
| Margin Growth (5Y Trend) ⓘ | -1.70% | -4.07% |
| FCF Growth (5Y CAGR) ⓘ | -15.71% | 4.96% |
| DPS Growth (5Y CAGR) ⓘ | -5.78% | 8.79% |
Quality (Business durability) | ||
| ROIC (Latest) ⓘ | N/A | 9.60% |
| ROE (Latest) ⓘ | 24.24% | 13.84% |
| ROA (Latest) ⓘ | 4.60% | 1.53% |
| ROIC (5Y Median) ⓘ | 12.96% | 7.86% |
| ROE (5Y Median) ⓘ | 11.26% | 12.20% |
| ROA (5Y Median) ⓘ | 2.13% | 1.29% |
| Net Debt / EBIT (Latest) ⓘ | -2.27 | 0.91 |
| Net Debt / EBIT (5Y Median) ⓘ | -6.54 | 0.74 |
| Net Debt / EBITDA (Latest) ⓘ | -1.77 | 0.97 |
| Operating Margin (Latest) ⓘ | 19.97% | 22.12% |
| Operating Margin (5Y Median) ⓘ | 21.24% | 24.39% |
| Debt to Equity (Latest) ⓘ | 14.26% | 60.37% |
| Profit Margin (Latest) ⓘ | 19.13% | 26.62% |
| Free Cash Flow (Latest) ⓘ | $1.95B | |
Momentum (Price trend) | ||
| 3Y Return ⓘ | +81.37% | +89.23% |
| 12M Return (excl. last month) ⓘ | +55.45% | +17.35% |
| 6M Return ⓘ | +8.63% | +10.00% |
| Price vs. 200-Day MA ⓘ | +20.84% | +3.73% |
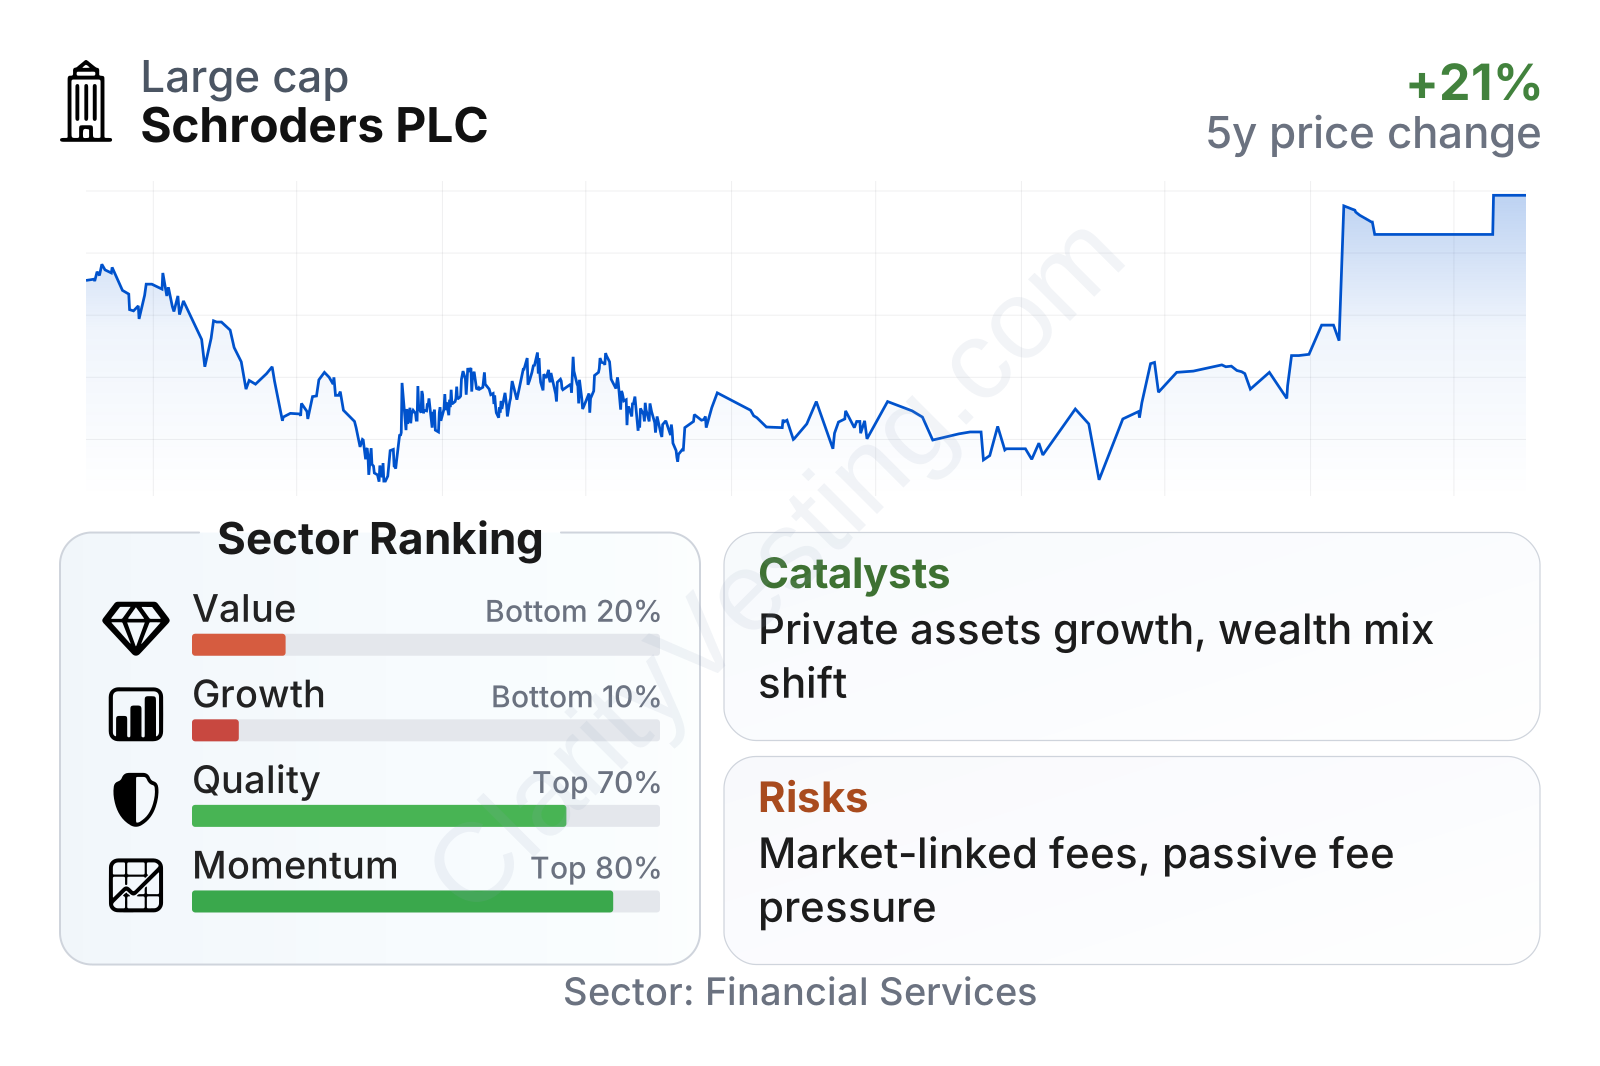
Schroders sits in the large-cap range for an asset manager, with share-price behavior that is a little more volatile than the overall market. The factor profile is mixed. Quality looks solid, supported by healthy returns on equity and assets, low leverage, and strong cash generation. Momentum has also improved, with the stock performing well over the last year. The weaker area is growth: recent revenue growth has been decent, but the longer-term record for earnings, book value per share, free cash flow, and dividends has been uneven compared with much of the sector. Valuation also looks demanding on book value, even though earnings and cash flow multiples are not extreme.
Growth
Schroders operates in a sector that should keep expanding over the long run, although not in a straight line. Global savings pools are rising, retirement systems continue shifting toward professionally managed assets, and private market investing is attracting more institutional and affluent capital. These trends support long-term demand for firms that can offer a broad product shelf and trusted distribution.
For Schroders specifically, the strategy is centered on building a more balanced mix of businesses. Traditional public-market asset management remains important, but the company has been investing in areas with potentially stronger structural demand, especially private assets, infrastructure, real estate, and wealth management. That makes strategic sense because these activities can provide stickier client relationships and, in some cases, better fee resilience than mainstream active equity funds.
The recent earnings path still needs to be read carefully. Schroders has returned to stronger profitability after a tougher period, but the longer-term earnings record has not been consistently upward. That matters because asset managers often look inexpensive on one year’s earnings near a market recovery, while their true cycle-adjusted earning power is less obvious.
Book value per share was fairly stable for several years before a visible drop in the latest period shown. For an asset-light financial business, book value is not the only measure that matters, but a decline can still point to pressure from capital allocation, distributions, market effects, or business mix changes. It is one reason the market’s current valuation needs extra scrutiny.
A meaningful catalyst is the company’s exposure to private markets and wealth management, where industry growth is often stronger than in traditional active mutual funds. Another positive driver is operating leverage: if markets remain supportive and net inflows improve, revenue can rise faster than costs for a period, helping margins and earnings recover. Recent company updates have also highlighted continued development of specialist capabilities and partnerships that broaden distribution and product depth.
Risks
This article is for informational purposes only and does not constitute financial advice. Some content is AI-generated. See Disclaimer


