Stock Analysis · Shell PLC (SHEL)
Overview
Shell is one of the world’s largest integrated energy companies. In simple terms, it operates across most of the oil and gas value chain: it explores for and produces crude oil and natural gas, liquefies and ships LNG, refines crude into fuels and chemicals, sells gasoline and diesel through a global retail network, trades energy and commodities, and is also building positions in lower-carbon electricity, biofuels, hydrogen, and charging for electric vehicles.
This broad model matters because Shell does not rely on a single activity. When crude prices are strong, its upstream business usually benefits. When refining margins, LNG trading, or fuel retail conditions improve, other divisions can help support results. That diversification is one of the main reasons Shell has remained one of the dominant names in global energy.
Based on Shell’s recent annual reporting structure, revenue is mainly generated by the following activities, listed from largest to smallest by broad contribution. These percentages are approximate because trading flows and transfer pricing can make exact comparisons less straightforward across segments:
- Marketing: approximately 40% to 50% of revenue. This includes fuel sales through service stations, lubricants, aviation, marine, and commercial fuels sold to business customers.
- Chemicals and Products: approximately 25% to 35%. This covers refining, oil products, chemicals manufacturing, and related trading and sales.
- Integrated Gas: approximately 15% to 25%. This includes LNG, gas-to-liquids, and some natural gas and power activities. This is strategically important because LNG often contributes a larger share of profit than its revenue share suggests.
- Upstream: approximately 5% to 15%. This is oil and gas production from fields around the world.
- Renewables and Energy Solutions: currently a small single-digit percentage of revenue. This includes power marketing and trading, EV charging, hydrogen, and selected renewable power activities.
Over the last several years, Shell’s total revenue has come down from the extraordinary 2022 peak as energy prices normalized, but operating income and net income have remained sizeable. That suggests a business that is still highly cash generative even outside the most favorable commodity environment.
The long-term pattern is clear: 2022 was an exceptional earnings year, while 2023 to 2025 showed lower but still robust profitability. Costs of revenue remain very large, which is normal in this industry, so the key question is less about top-line size and more about how much cash and operating profit Shell can keep through the cycle.
Key Figures
| Metric | Value | Sector ⓘ |
|---|---|---|
| Date | Oct 24, 2026 | |
| Context | ||
| Sector | Energy | |
| Industry | Oil & Gas Integrated | |
| Market Cap ⓘ | $300.20B | |
| Beta ⓘ | -0.19 | |
Value (Cheapness) | ||
| P/E Ratio ⓘ | 11.65 | 15.40 |
| P/B Ratio ⓘ | 1.65 | 1.71 |
| FCF Yield ⓘ | 10.26% | 8.24% |
| Dividend Yield ⓘ | 1.44% | 3.52% |
| EBIT / EV ⓘ | 13.98% | 7.45% |
| PEG ⓘ | 1.59 | |
Growth (Business expansion) | ||
| Revenue Growth ⓘ | 44.70% | 26.85% |
| RPS Growth (5Y CAGR) ⓘ | 7.58% | 6.78% |
| EPS Growth (5Y CAGR) ⓘ | -14.41% | -14.41% |
| BVPS Growth (5Y CAGR) ⓘ | 7.26% | 6.08% |
| Margin Growth (5Y Trend) ⓘ | 0.14% | 0.55% |
| FCF Growth (5Y CAGR) ⓘ | -2.17% | 2.75% |
| DPS Growth (5Y CAGR) ⓘ | 15.48% | 16.79% |
Quality (Business durability) | ||
| ROIC (Latest) ⓘ | 14.27% | 11.30% |
| ROA (Latest) ⓘ | 6.85% | 6.00% |
| ROIC (5Y Median) ⓘ | 10.41% | 10.35% |
| ROA (5Y Median) ⓘ | 4.71% | 5.46% |
| Net Debt / EBIT (Latest) ⓘ | 0.96 | 1.64 |
| Net Debt / EBIT (5Y Median) ⓘ | 1.15 | 1.82 |
| Net Debt / EBITDA (Latest) ⓘ | 0.63 | 1.08 |
| Net Debt / Assets ⓘ | 10.96% | 17.29% |
| EBITDA / Interest ⓘ | 13.06 | 9.53 |
| Operating Margin (Latest) ⓘ | 14.59% | 16.21% |
| Operating Margin (5Y Median) ⓘ | 12.79% | 20.55% |
| Debt to Equity (Latest) ⓘ | 40.42% | 52.27% |
| Profit Margin (Latest) ⓘ | 8.76% | 8.79% |
| Free Cash Flow (Latest) ⓘ | $30.80B | |
Momentum (Price trend) | ||
| 3Y Return ⓘ | +76.86% | +68.93% |
| 12M Return (excl. last month) ⓘ | +36.67% | +42.90% |
| 6M Return ⓘ | +20.96% | +9.18% |
| Price vs. 200-Day MA ⓘ | +22.37% | +9.87% |
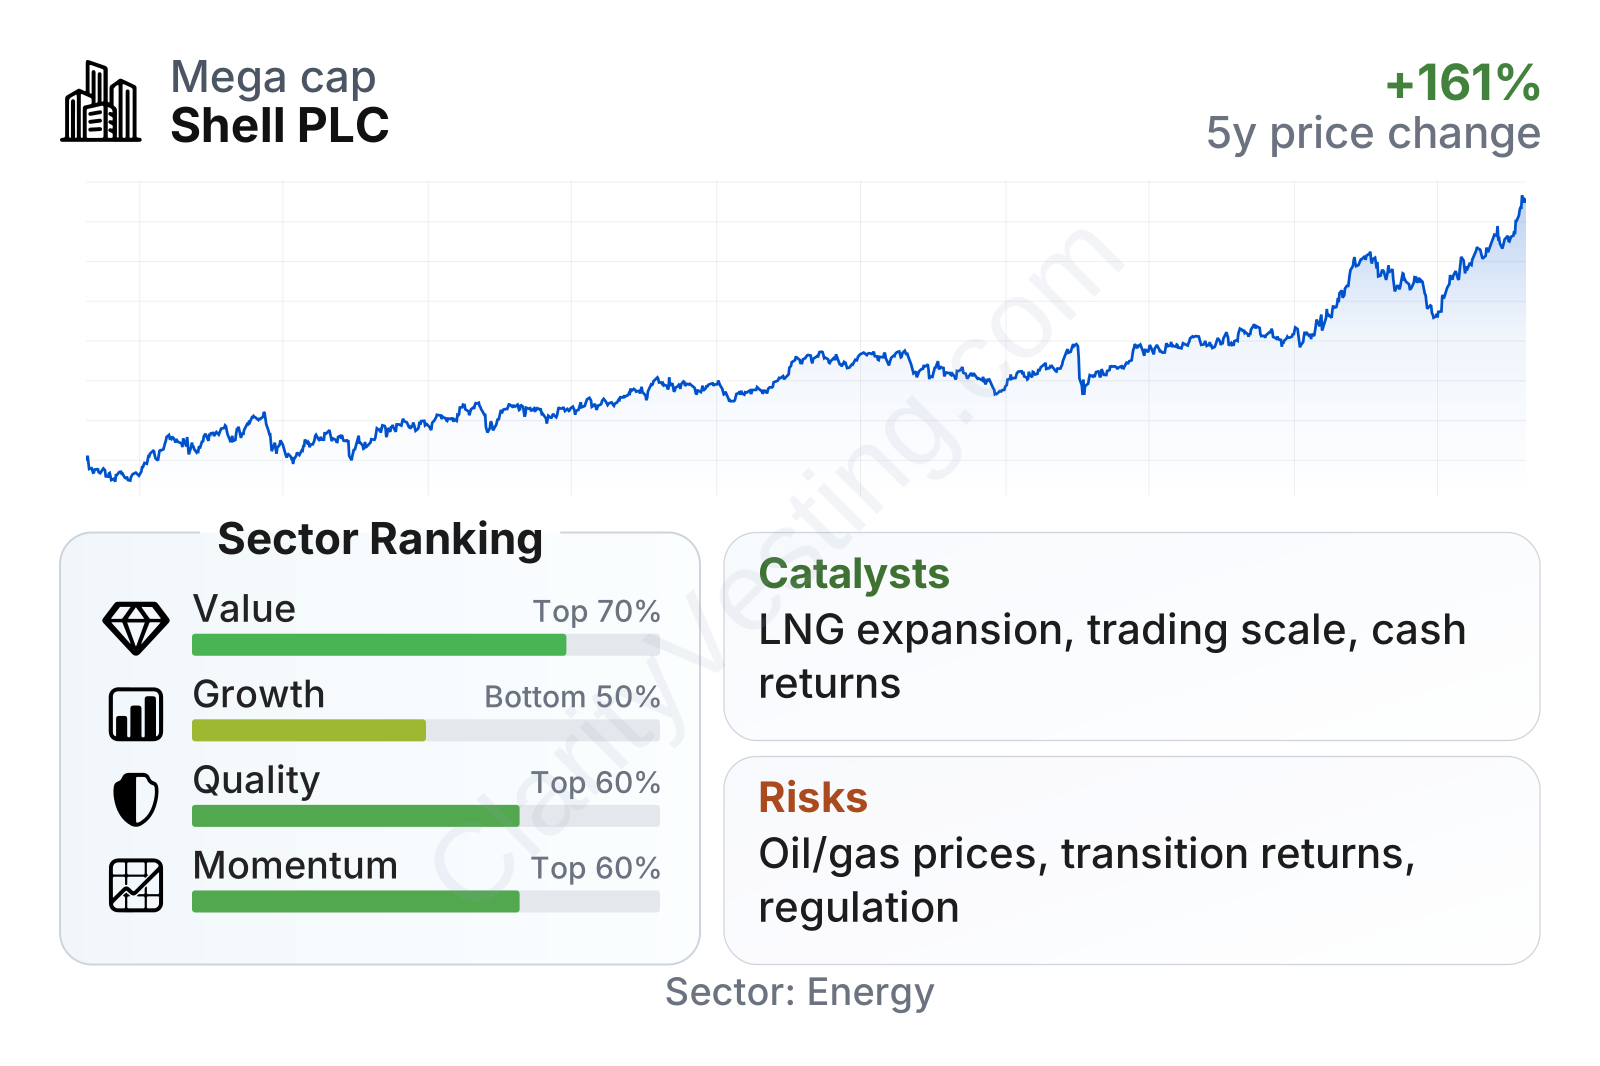
Shell is a very large energy company with valuation metrics that remain below or around sector norms on earnings and book value, while cash generation looks stronger than the industry median. The quality profile is supported by solid returns on capital and relatively conservative leverage. Growth metrics are more mixed: recent revenue rebounded sharply, but five-year free cash flow and margin trends are less impressive than some peers. Price performance has been positive over multi-year periods, although shorter-term momentum has not been as strong as the best names in the sector.
The share price trend over the past five years shows a strong recovery and then a continued advance, although with the usual swings that come with commodity-linked businesses. That pattern fits Shell’s profile as a global energy major whose earnings power can change materially with oil, gas, LNG, refining, and trading conditions.
Growth
Shell operates in a sector that is mature in oil products, but still growing in selected areas such as LNG, power trading, biofuels, and electricity solutions. The most important growth engine is not traditional oil demand alone. It is the growing global need for reliable energy, especially natural gas and LNG, which many countries use for power generation, industrial demand, and energy security. That is an area where Shell is already a global heavyweight.
Its strategy is reasonably coherent for that backdrop. Shell has been emphasizing capital discipline, high-return upstream and LNG projects, strong trading capabilities, and selective investment in lower-carbon businesses rather than trying to grow every transition segment at once. For a company of this size, that approach is notable because it tries to protect returns while still building exposure to future energy demand patterns.
Revenue growth has been volatile, which is normal for an integrated energy company. The recent rebound is significant after a long period of contraction from post-2022 normalization, but it should be read carefully: in this sector, sharp year-over-year changes often reflect commodity prices and trading conditions as much as underlying volume growth. Over a five-year view, Shell’s revenue per share growth has still been somewhat ahead of the sector median, which points to resilient business scale.
Free cash flow remains one of the most important positive features in Shell’s profile. Even though trailing free cash flow has moved down from earlier highs, the absolute level is still very large. That cash supports dividends, share repurchases, debt management, and continued investment in LNG and other core projects. For long-term analysis, that matters more than whether one individual year is above or below a previous peak.
One of the strongest catalysts is Shell’s LNG position. Global LNG demand is expected to expand over time as Asia adds energy capacity, Europe seeks diversified gas supply, and industry looks for fuels with lower emissions than coal. Shell already has scale in liquefaction, shipping, trading, and customer relationships, giving it a credible platform to capture that demand.
Another meaningful catalyst is the company’s trading and optimization capability. Shell has one of the broadest energy trading networks among the majors, and that can create value from market dislocations, logistics, and balancing supply chains. This tends to be especially useful in volatile energy markets.
Recent company communications have also continued to emphasize performance improvements, portfolio focus, and shareholder distribution backed by cash generation. In practical terms, that means Shell is trying to combine steady hydrocarbon cash flows with measured exposure to parts of the energy transition where it believes returns can be attractive, particularly gas, LNG, and power-related activities.
Risks
This article is for informational purposes only and does not constitute financial advice. Some content is AI-generated. See Disclaimer


