Stock Analysis · Shangri-La Asia Ltd (SHALY)
Overview
Shangri-La Asia Ltd is a hotel owner, operator, and property company focused mainly on Asia and the Middle East. Its best-known brands include Shangri-La, Kerry, Hotel Jen, and Traders. The group operates luxury and upper-upscale hotels and resorts, while also generating income from investment properties and residential units tied to its developments. In simple terms, this is a hospitality business with a meaningful real estate component, not just a pure hotel management company.
The company’s revenue base is led by hotel operations. Based on recent annual reporting and segment disclosures, the main sources of revenue appear to be:
- Hotel operations: about 75% to 85% of revenue. This includes room sales, food and beverage, and other hotel-related services across owned and leased properties.
- Property rentals and related services: about 8% to 15%. This usually comes from office, retail, and commercial leasing within mixed-use developments.
- Property sales and other activities: about 3% to 10%. This can include residential unit sales, club operations, and other support businesses, depending on the year.
That mix matters because hotel earnings are cyclical and tied to travel demand, while rental income can add some stability. Shangri-La’s footprint is also concentrated in gateway cities and premium destinations, which supports brand positioning but can make results more sensitive to regional tourism trends, China demand, and corporate travel conditions.
Over the last several years, the business has recovered sharply from pandemic-era losses. Revenue climbed from roughly $1.2 billion in 2021 to about $2.23 billion in 2025, and operating profit moved from a deep loss to a clearly positive level. Even so, interest costs remain heavy, which means a solid operating business does not fully translate into equally strong net profit.
The income profile shows a major recovery since 2021: sales and operating profit improved materially, and margins stayed strong through 2024 and 2025. The main pressure point is financing cost, which still absorbs a large share of operating earnings and limits how much profit reaches shareholders.
Key Figures
| Metric | Value | Sector ⓘ |
|---|---|---|
| Date | Oct 17, 2026 | |
| Context | ||
| Sector | Consumer Cyclical | |
| Industry | Lodging | |
| Market Cap ⓘ | $1.80B | |
| Beta ⓘ | 0.49 | |
Value (Cheapness) | ||
| P/E Ratio ⓘ | 12.60 | 16.89 |
| P/B Ratio ⓘ | 0.36 | 1.61 |
| FCF Yield ⓘ | 25.82% | 8.99% |
| Dividend Yield ⓘ | 3.79% | 2.73% |
| EBIT / EV ⓘ | 16.17% | 6.69% |
| PEG ⓘ | 15.71 | |
Growth (Business expansion) | ||
| Revenue Growth ⓘ | 6.40% | 5.60% |
| RPS Growth (5Y CAGR) ⓘ | 15.70% | 8.91% |
| EPS Growth (5Y CAGR) ⓘ | N/A | -17.41% |
| BVPS Growth (5Y CAGR) ⓘ | -3.78% | 5.62% |
| Margin Growth (5Y Trend) ⓘ | 58.63% | -0.17% |
| FCF Growth (5Y CAGR) ⓘ | N/A | 4.91% |
| DPS Growth (5Y CAGR) ⓘ | -3.45% | 9.86% |
Quality (Business durability) | ||
| ROIC (Latest) ⓘ | 5.92% | 12.38% |
| ROA (Latest) ⓘ | 1.89% | 5.49% |
| ROIC (5Y Median) ⓘ | 3.31% | 10.75% |
| ROA (5Y Median) ⓘ | 0.80% | 5.44% |
| Net Debt / EBIT (Latest) ⓘ | 5.97 | 2.17 |
| Net Debt / EBIT (5Y Median) ⓘ | 8.30 | 2.30 |
| Net Debt / EBITDA (Latest) ⓘ | 4.14 | 1.50 |
| Net Debt / Assets ⓘ | 45.39% | 21.57% |
| EBITDA / Interest ⓘ | 2.62 | 9.13 |
| Operating Margin (Latest) ⓘ | 25.06% | 9.10% |
| Operating Margin (5Y Median) ⓘ | 28.25% | 9.56% |
| Debt to Equity (Latest) ⓘ | 149.09% | 75.99% |
| Profit Margin (Latest) ⓘ | 6.23% | 5.31% |
| Free Cash Flow (Latest) ⓘ | $464.65M | |
Momentum (Price trend) | ||
| 3Y Return ⓘ | -20.65% | +15.94% |
| 12M Return (excl. last month) ⓘ | -9.76% | -2.82% |
| 6M Return ⓘ | -10.77% | -1.58% |
| Price vs. 200-Day MA ⓘ | -21.90% | -3.31% |
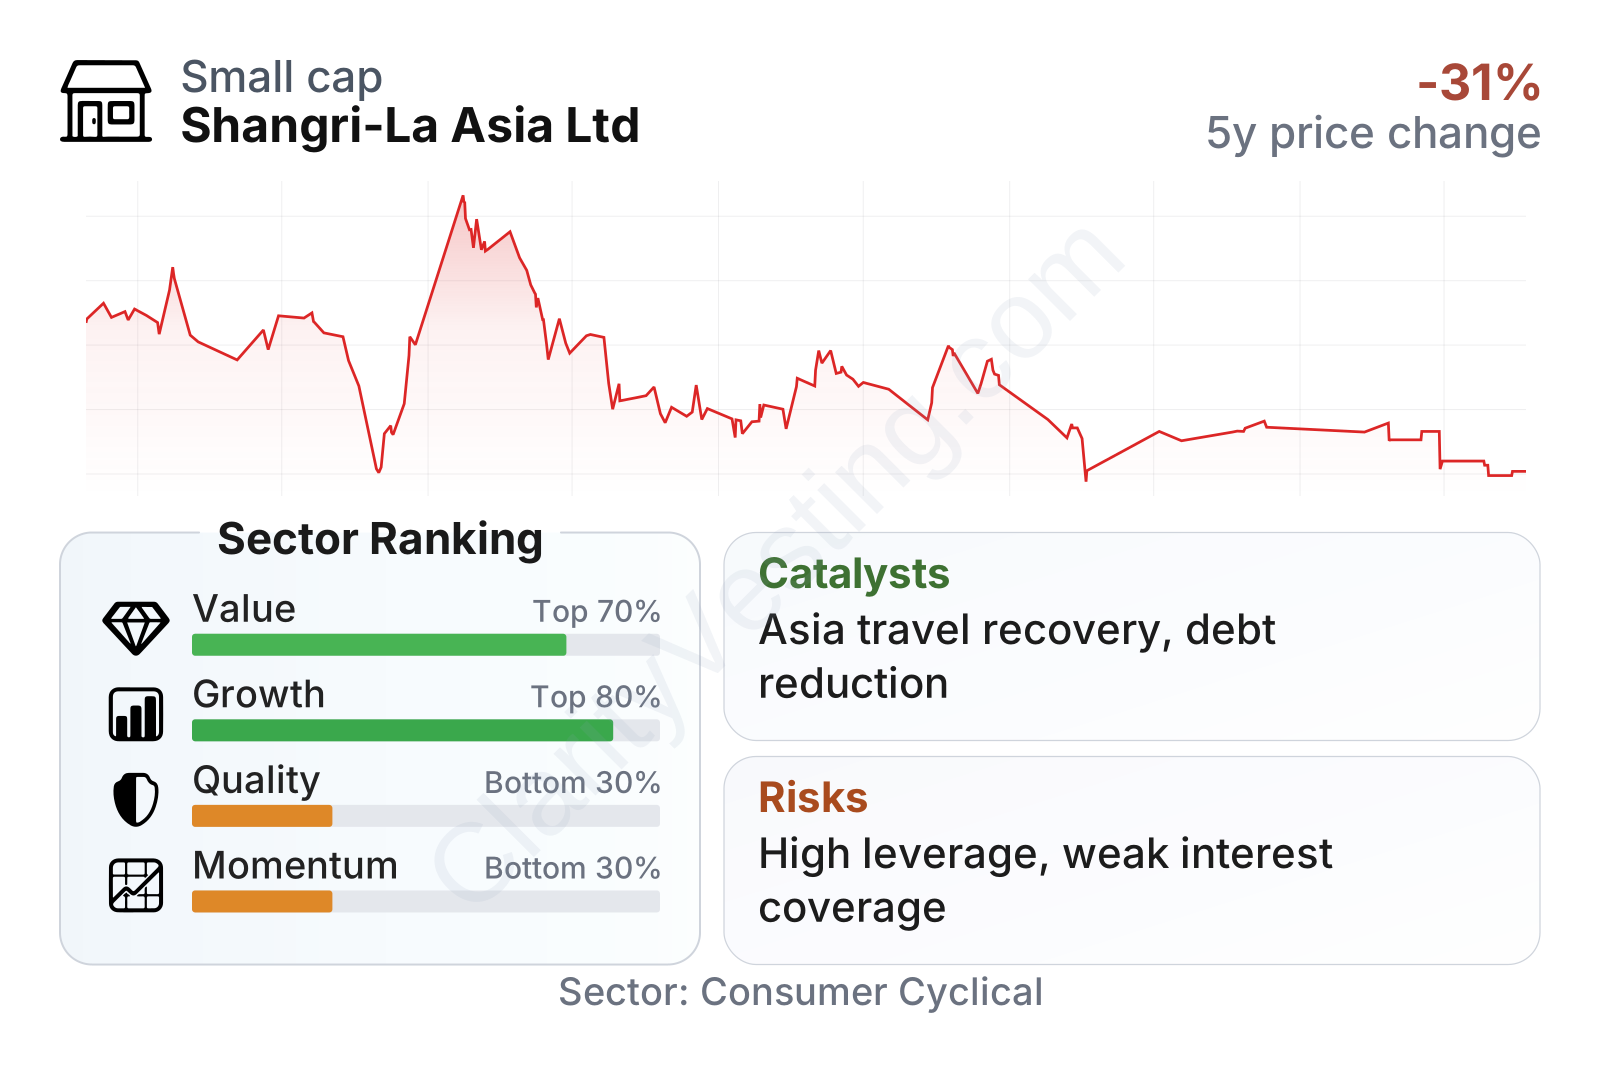
The overall picture is unusual. On valuation and cash generation, Shangri-La screens well versus much of the lodging sector: its earnings multiple is below the sector median, free cash flow yield is high, and the dividend yield is also above the median. Growth metrics are also relatively solid, supported by multi-year revenue expansion and a very strong improvement in operating margin compared with five years ago.
The weaker side is balance-sheet quality. Returns on capital and assets are below sector norms, while debt metrics are stretched. Net debt relative to EBIT and EBITDA is high, debt-to-equity is elevated, and interest coverage is much thinner than the sector median. Market performance has also been weak, with the shares down over one, three, and six-month comparison periods and trading well below their long-term trend line. In short, the business looks cheap and cash generative, but financially burdened and out of favor.
Growth
Shangri-La operates in a sector that still has a long-term growth foundation. International travel, premium leisure spending, and mixed-use urban hospitality remain attractive themes over time, especially in Asia. Rising wealth in parts of Asia and the Middle East also supports demand for luxury hotels, branded residences, destination dining, and premium event spaces. That said, lodging is not a smooth growth industry. It tends to move in cycles and can swing quickly with the economy, geopolitics, or travel restrictions.
The company’s strategy makes sense in broad terms. Shangri-La combines hotel operations with ownership of prime real estate. That can create multiple income streams from the same assets: guestrooms, restaurants, banqueting, retail leasing, offices, and occasionally residential sales. It also gives the company some asset backing that is uncommon among lighter, management-fee-focused hotel groups. For a long-term view, that structure can be appealing when properties are well located and financed sensibly.
A meaningful catalyst is continued normalization in Asia travel and meetings activity, especially if room rates remain firm and occupancy keeps improving. The company has already shown that stronger demand can expand margins significantly. Another potential support is portfolio optimization: asset disposals, redevelopment, debt reduction, and selective openings can all improve equity value if management executes well. In a business carrying high leverage, even moderate operating improvement can have an outsized effect on net earnings once financing pressure starts to ease.
Recent company reporting also points to resilience rather than a post-reopening collapse. Revenue kept moving upward into 2025, reaching roughly $2.23 billion, while operating income remained robust at about $657 million. That suggests the recovery was not just a one-year rebound. The key question now is whether Shangri-La can convert that healthier operating base into stronger bottom-line returns after interest expense.
Risks
This article is for informational purposes only and does not constitute financial advice. Some content is AI-generated. See Disclaimer


