Stock Analysis · Shangri-La Asia Limited (SHALF)
Overview
Shangri-La Asia Limited is a hotel owner and operator focused on upscale and luxury hospitality in Asia and the Middle East. The group is best known for its Shangri-La brand, but it also operates other brands such as Kerry Hotels, Hotel Jen, Traders, and several mixed-use properties that combine hotels with offices, residences, and retail space. Its business model is not limited to running hotels: it also earns money from investment properties and residential property sales, which makes the company more diversified than a pure hotel operator.
The company’s revenue mix can move from year to year because hotel demand, room rates, property sales, and rental income do not follow the same pattern. Based on the latest annual reporting, the broad sources of revenue appear to be:
- Hotel operations: about 75% to 85% — room revenue, food and beverage, events, and related hospitality services across owned and managed hotels.
- Property rentals and related services: about 10% to 20% — recurring income from offices, commercial space, and investment properties attached to some developments.
- Property sales and other activities: about 0% to 10% — mainly sales of residential units or other real estate-related items, which can be irregular.
That mix matters because hotel operations give the company exposure to tourism and business travel recovery, while rental income adds a steadier stream and property sales can create occasional boosts but also more volatility.
Over the last few years, the business has clearly recovered from pandemic-era weakness. Revenue rose from roughly $1.24 billion in 2021 to about $2.24 billion in 2025, while operating profit moved from losses in 2021 and 2022 to solid profitability in 2023 through 2025. Another notable point is that the company’s cost base has not risen as fast as revenue since the recovery, which helped margins improve meaningfully.
The overall picture is of a mid-sized lodging group with valuable real estate exposure, premium branding in Asia, and a business structure that mixes cyclical hotel earnings with some recurring property income.
Key Figures
| Metric | Value | Sector ⓘ |
|---|---|---|
| Date | Oct 03, 2026 | |
| Context | ||
| Sector | Consumer Cyclical | |
| Industry | Lodging | |
| Market Cap ⓘ | $1.91B | |
| Beta ⓘ | 0.51 | |
Value (Cheapness) | ||
| P/E Ratio ⓘ | 13.38 | 17.04 |
| P/B Ratio ⓘ | 0.35 | 1.61 |
| FCF Yield ⓘ | 38.03% | 9.02% |
| Dividend Yield ⓘ | 3.23% | 2.75% |
| EBIT / EV ⓘ | 17.47% | 6.69% |
| PEG ⓘ | 0.78 | |
Growth (Business expansion) | ||
| Revenue Growth ⓘ | 6.40% | 5.60% |
| RPS Growth (5Y CAGR) ⓘ | 15.84% | 9.04% |
| EPS Growth (5Y CAGR) ⓘ | N/A | -17.44% |
| BVPS Growth (5Y CAGR) ⓘ | -2.49% | 5.73% |
| Margin Growth (5Y Trend) ⓘ | 58.63% | -0.26% |
| FCF Growth (5Y CAGR) ⓘ | N/A | 4.91% |
| DPS Growth (5Y CAGR) ⓘ | -3.47% | 10.48% |
Quality (Business durability) | ||
| ROIC (Latest) ⓘ | 6.36% | 12.38% |
| ROA (Latest) ⓘ | 1.89% | 5.54% |
| ROIC (5Y Median) ⓘ | 1.52% | 10.63% |
| ROA (5Y Median) ⓘ | 0.81% | 5.44% |
| Net Debt / EBIT (Latest) ⓘ | 5.56 | 2.16 |
| Net Debt / EBIT (5Y Median) ⓘ | 8.30 | 2.31 |
| Net Debt / EBITDA (Latest) ⓘ | 3.94 | 1.52 |
| Net Debt / Assets ⓘ | 45.67% | 21.74% |
| EBITDA / Interest ⓘ | 2.77 | 9.06 |
| Operating Margin (Latest) ⓘ | 27.04% | 9.12% |
| Operating Margin (5Y Median) ⓘ | 10.70% | 9.56% |
| Debt to Equity (Latest) ⓘ | 149.86% | 76.18% |
| Profit Margin (Latest) ⓘ | 6.23% | 5.30% |
| Free Cash Flow (Latest) ⓘ | $726.93M | |
Momentum (Price trend) | ||
| 3Y Return ⓘ | -24.44% | +11.77% |
| 12M Return (excl. last month) ⓘ | +7.10% | +0.61% |
| 6M Return ⓘ | -8.42% | +1.32% |
| Price vs. 200-Day MA ⓘ | -36.75% | -3.47% |
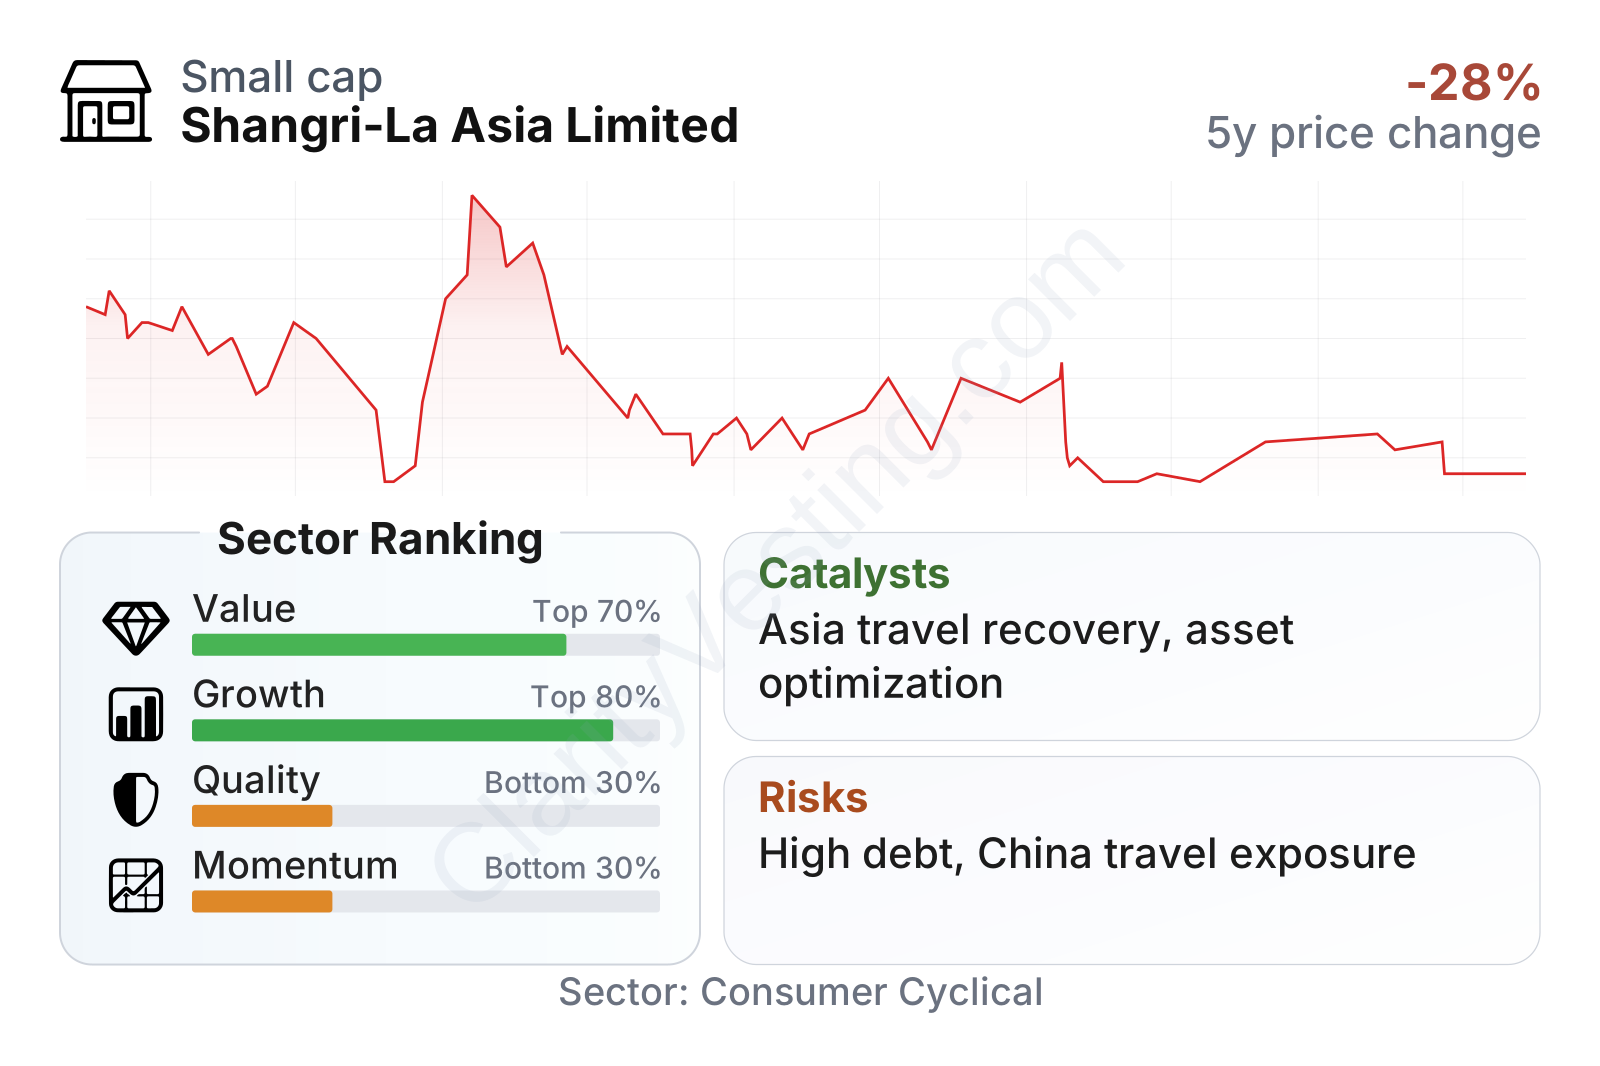
The recent snapshot looks mixed in a useful way. On valuation, Shangri-La Asia screens cheaper than many lodging peers, with a lower earnings multiple, a very low price-to-book ratio, and unusually strong free cash flow yield. Growth measures are relatively strong versus the sector, especially over a five-year period for revenue per share and operating margin improvement. The weak area is balance-sheet quality: leverage is elevated, debt servicing is less comfortable than the sector median, and returns on capital remain below many peers despite the margin recovery.
The stock has also lagged over a multi-year period even though the business has improved. That gap between stronger operations and weaker share performance is one reason the company can look inexpensive on several metrics.
Growth
The company operates in a sector that still has room to expand over the long term. Lodging demand in Asia benefits from rising middle-class travel, the continued reopening and normalization of regional tourism flows, premium business travel, and the growth of mixed-use urban developments. Luxury and upper-upscale hotels can also benefit when inflation allows operators to lift room rates, especially in prime gateway cities where land supply is limited.
Shangri-La Asia’s strategy is broadly coherent for that environment. It already has a recognized luxury brand, a concentration in major Asian markets, and a portfolio that combines hotels with commercial and residential assets. That structure can help in two ways: premium hotels can capture travel recovery, while investment properties can contribute steadier cash generation. The company has also shown clear operating improvement since the downturn, with revenue climbing at a mid-single-digit pace most recently and much faster over the full recovery period.
A meaningful catalyst is continued normalization in travel demand across Greater China and the rest of Asia. The company has substantial exposure to markets where occupancy and room rates can still improve as international traffic, conferences, and high-end leisure travel continue to rebuild. Another favorable factor is that the group’s brands are positioned toward customers who are usually less price-sensitive than mass-market travelers.
Recent company reporting also points to ongoing asset optimization, cost discipline, and a focus on improving returns from existing properties rather than relying only on aggressive expansion. For a hotel owner with a large asset base, that can be important: stronger pricing, better occupancy, and improved property utilization often create more value than simply adding more rooms.
Risks
This article is for informational purposes only and does not constitute financial advice. Some content is AI-generated. See Disclaimer


