Stock Analysis · Singapore Technologies Engineering Ltd (SGGKY)
Overview
Singapore Technologies Engineering Ltd, usually called ST Engineering, is a large Singapore-based engineering and technology group operating across defense, aerospace, smart city, and public security markets. Its business is built around designing, maintaining, upgrading, and operating mission-critical systems. In simple terms, the company helps governments, airlines, transport operators, telecom customers, and industrial clients keep essential equipment and infrastructure running safely and efficiently.
Over the last few years, ST Engineering has increasingly focused on a mix of recurring services and long-cycle contracts rather than one-off equipment sales. That matters for long-term analysis because maintenance, software-enabled services, and long-term support work can make revenue more predictable than pure project-based manufacturing.
The company reports its business through three main segments. Based on the latest annual reporting and recent business mix, the revenue structure is approximately:
- Commercial Aerospace, about 44% — aircraft maintenance, repair and overhaul, airframe and engine services, passenger-to-freighter conversions, and aerospace components and interiors.
- Urban Solutions & Satcom, about 31% — smart mobility systems, tolling and fare collection, command-and-control and public safety platforms, critical communications, cybersecurity-related capabilities, and satellite communications services.
- Defense & Public Security, about 25% — land systems, naval engineering, defense electronics, training and simulation, digital systems for security agencies, and lifecycle support for military platforms.
This mix is useful to understand the company’s profile. Aerospace ties ST Engineering to global aviation demand, while defense and public security add resilience through government-linked spending. Urban solutions and satcom give it exposure to digital infrastructure and communications, which broadens the business beyond classic defense contracting.
The operating picture over recent years shows rising revenue and operating income, with gross profit also moving higher. At the same time, net income has been more uneven than operating profit, which suggests financing costs, taxes, acquisition effects, or integration costs can influence the final bottom line more than the core business trend alone.
The business has clearly expanded its top line since 2021, and operating profit has generally followed that trend. The more mixed pattern at net income level shows why it is important to watch not just sales growth, but also financing structure and execution quality.
Key Figures
| Metric | Value | Sector ⓘ |
|---|---|---|
| Date | Oct 17, 2026 | |
| Context | ||
| Sector | Industrials | |
| Industry | Aerospace & Defense | |
| Market Cap ⓘ | $26.08B | |
| Beta ⓘ | 0.15 | |
Value (Cheapness) | ||
| P/E Ratio ⓘ | 58.89 | 22.10 |
| P/B Ratio ⓘ | 12.00 | 1.97 |
| FCF Yield ⓘ | 7.54% | 6.38% |
| Dividend Yield ⓘ | 1.77% | 1.94% |
| EBIT / EV ⓘ | N/A | 4.79% |
| PEG ⓘ | 1.16 | |
Growth (Business expansion) | ||
| Revenue Growth ⓘ | 11.10% | 9.30% |
| RPS Growth (5Y CAGR) ⓘ | 13.25% | 7.81% |
| EPS Growth (5Y CAGR) ⓘ | 1.40% | -13.06% |
| BVPS Growth (5Y CAGR) ⓘ | -2.08% | 6.14% |
| Margin Growth (5Y Trend) ⓘ | 0.09% | 0.88% |
| FCF Growth (5Y CAGR) ⓘ | 11.34% | 11.01% |
| DPS Growth (5Y CAGR) ⓘ | 2.68% | 9.48% |
Quality (Business durability) | ||
| ROIC (Latest) ⓘ | N/A | 10.84% |
| ROA (Latest) ⓘ | 6.59% | 5.41% |
| ROIC (5Y Median) ⓘ | 12.67% | 9.38% |
| ROA (5Y Median) ⓘ | 3.05% | 4.95% |
| Net Debt / EBIT (Latest) ⓘ | 2.36 | 2.08 |
| Net Debt / EBIT (5Y Median) ⓘ | 4.60 | 2.27 |
| Net Debt / EBITDA (Latest) ⓘ | 1.58 | 1.39 |
| Net Debt / Assets ⓘ | 26.72% | 19.28% |
| EBITDA / Interest ⓘ | 9.76 | 9.58 |
| Operating Margin (Latest) ⓘ | 9.84% | 10.50% |
| Operating Margin (5Y Median) ⓘ | 9.79% | 10.29% |
| Debt to Equity (Latest) ⓘ | 187.23% | 65.48% |
| Profit Margin (Latest) ⓘ | 4.40% | 6.67% |
| Free Cash Flow (Latest) ⓘ | $1.97B | |
Momentum (Price trend) | ||
| 3Y Return ⓘ | +213.39% | +61.68% |
| 12M Return (excl. last month) ⓘ | +39.48% | +12.58% |
| 6M Return ⓘ | -4.15% | 0.00% |
| Price vs. 200-Day MA ⓘ | +23.52% | +0.02% |
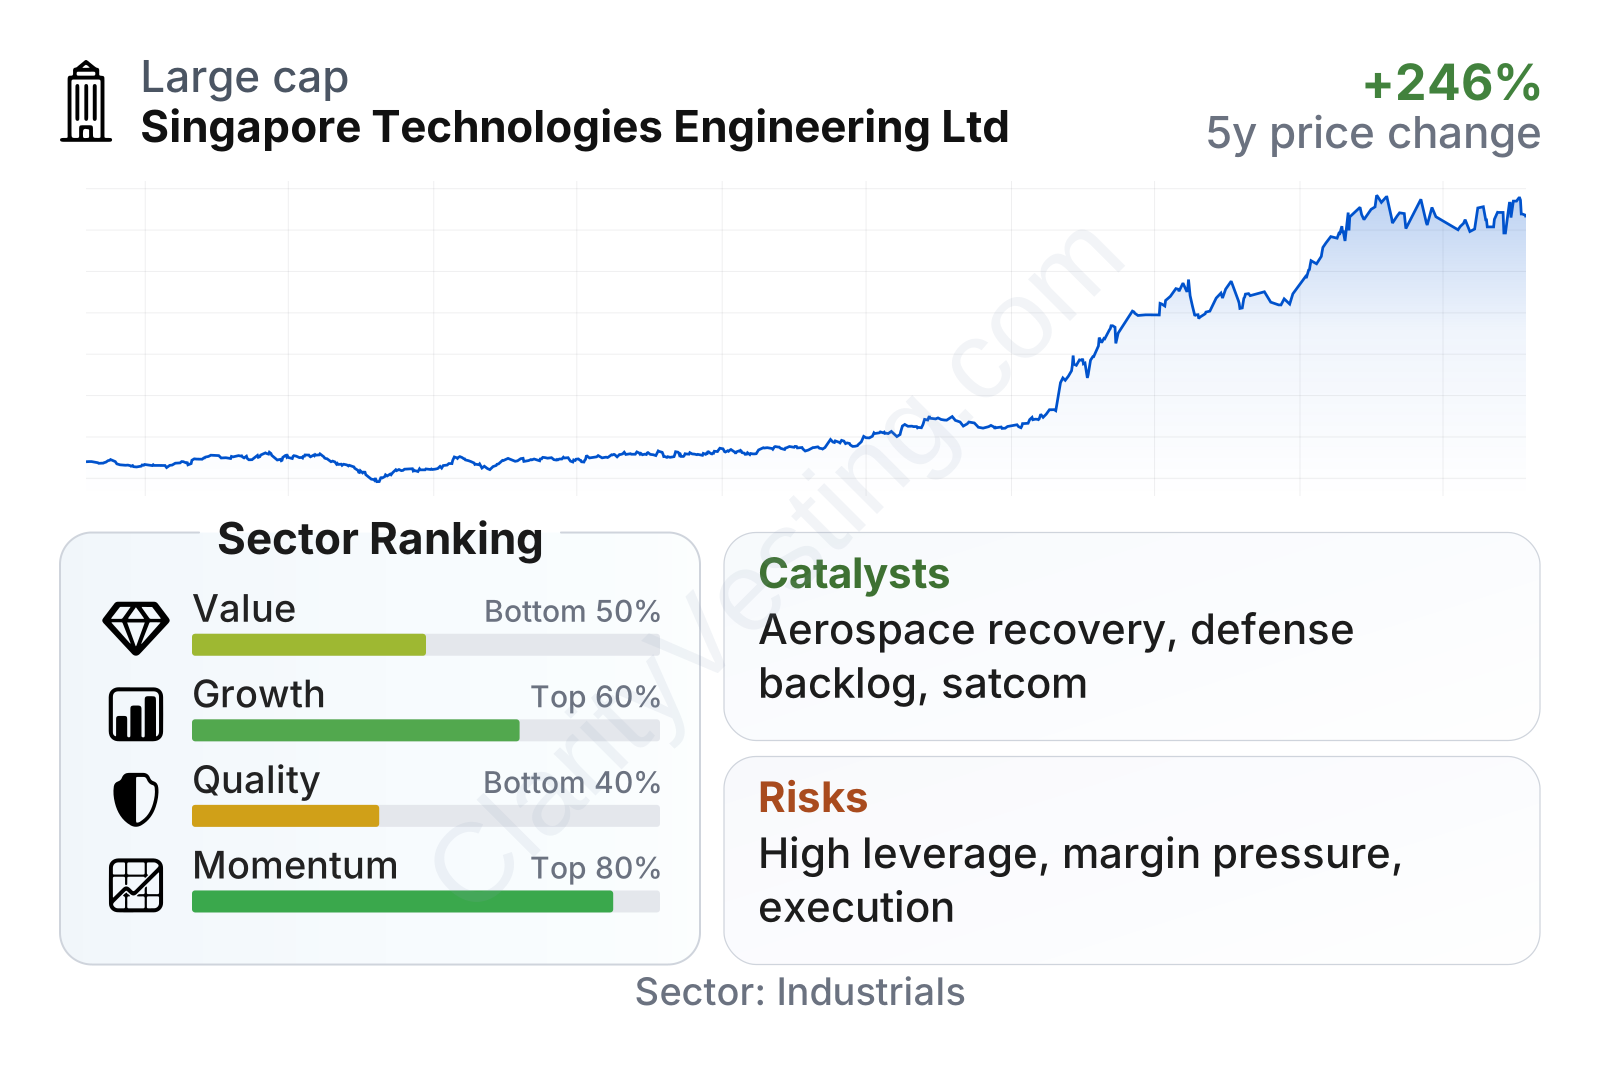
ST Engineering is a large industrial company with unusually low share-price volatility for the sector, as shown by its very low beta. The factor profile is mixed: growth and momentum rank relatively well, value looks weaker because the earnings and book multiples are high, and quality is dragged down by leverage and margins that sit below many industry peers. Free cash flow is a more supportive point, with cash generation comparing reasonably well against the sector.
The stock’s long-term price trend has been very strong, especially since 2024. That strength reflects improving business momentum and a market that has become more willing to pay up for the company’s combination of aerospace recovery, defense exposure, and digital infrastructure activities.
Growth
ST Engineering operates in several areas that have supportive long-term demand. Commercial aerospace has benefited from the recovery in global flight activity, aging fleets, and the need for maintenance capacity. Defense and public security spending remains structurally supported in many countries by higher geopolitical tension and modernization programs. Urban systems, communications, and satcom are also tied to long-duration themes such as smarter transport networks, public safety digitization, and secure connectivity.
The company’s strategy broadly makes sense for future growth because it combines cyclical recovery businesses with more defensive and contract-driven activities. Aerospace can grow when airline traffic and cargo demand improve, while defense and government-linked projects can help smooth weaker periods. The satcom and urban solutions operations also give ST Engineering a path into software, communications infrastructure, and managed services, which are often more recurring than traditional hardware work.
Recent growth metrics point to a business that has been expanding at a healthy pace. Year-over-year revenue growth is running above the sector median, and the five-year trend in revenue per share also compares favorably with most peers. That indicates the company has not only recovered from pandemic-era aerospace weakness, but has also widened its activity base.
Cash generation is another constructive element. Free cash flow has moved up meaningfully from late 2024 into mid-2025, which suggests the company is translating more of its revenue and operating profit into usable cash. For a business with project work, maintenance activity, and acquisitions, that is important because strong cash flow supports debt service, dividends, and reinvestment capacity.
A notable catalyst is the company’s large order book and continued contract wins across aerospace, defense, public safety, and communications. In recent company updates, management has continued to highlight strong demand visibility from long-cycle programs and service contracts. Another important opportunity comes from freighter conversions and aircraft maintenance capacity, where tight industry supply can support utilization and pricing. In satcom and digital systems, governments and enterprises are also still investing in secure communications and operational technology platforms.
Risks
This article is for informational purposes only and does not constitute financial advice. Some content is AI-generated. See Disclaimer


