Stock Analysis · Singapore Technologies Engineering Ltd (SGGKF)
Overview
Singapore Technologies Engineering Ltd, usually called ST Engineering, is a large Singapore-based engineering and technology group focused on defense, public security, transport, and industrial systems. Its businesses serve governments, militaries, airports, airlines, rail operators, smart-city programs, and commercial customers. The company has gradually shifted from a traditional engineering conglomerate into a more technology-led platform with stronger exposure to aerospace services, defense electronics, digital systems, and urban solutions.
Its revenue base is diversified across several operating segments. Based on the latest annual reporting structure, the main sources of revenue are approximately:
- Commercial Aerospace – about 39%: aircraft maintenance, repair and overhaul, passenger-to-freighter conversions, engine and component services, and aviation parts and solutions.
- Urban Solutions & Satcom – about 28%: rail electronics, fare collection, smart mobility, tolling, traffic systems, command-and-control software, and satellite communications.
- Defense & Public Security – about 20%: mission systems, defense electronics, cyber, land systems, naval engineering, training, and security-related platforms and services.
- Commercial Defense / Other engineering activities – about 13%: commercial vehicle-related activities, specialty engineering, and other smaller industrial programs tied to the group’s broader technology base.
This mix matters because it gives ST Engineering exposure to both recurring service work and long-cycle government programs. Aerospace tends to benefit from flight activity and fleet conversions, while defense and public security usually provide multi-year contracts with relatively steady demand. Urban Solutions adds another layer through infrastructure and communications projects that can grow with city digitalization and transport upgrades.
The business flow also shows a company that has expanded meaningfully over the last several years, with revenue rising from roughly $7.7 billion in 2021 to about $12.3 billion in 2025. Operating profit also increased over that span, although net income was weaker in 2025 than in 2024, suggesting that growth in sales did not fully translate into bottom-line expansion.
The overall picture is of a sizable industrial technology company with a broad customer base and multiple end markets, rather than a narrow single-product business. That diversification is one of its defining characteristics.
Key Figures
| Metric | Value | Sector ⓘ |
|---|---|---|
| Date | Oct 31, 2026 | |
| Context | ||
| Sector | Industrials | |
| Industry | Aerospace & Defense | |
| Market Cap ⓘ | $24.97B | |
| Beta ⓘ | 0.15 | |
Value (Cheapness) | ||
| P/E Ratio ⓘ | 57.21 | 21.91 |
| P/B Ratio ⓘ | 11.58 | 1.97 |
| FCF Yield ⓘ | 7.81% | 6.34% |
| Dividend Yield ⓘ | 2.37% | 1.88% |
| EBIT / EV ⓘ | N/A | 4.83% |
| PEG ⓘ | 1.08 | |
Growth (Business expansion) | ||
| Revenue Growth ⓘ | 11.10% | 9.50% |
| RPS Growth (5Y CAGR) ⓘ | 12.44% | 7.67% |
| EPS Growth (5Y CAGR) ⓘ | -37.32% | -11.63% |
| BVPS Growth (5Y CAGR) ⓘ | -2.10% | 6.14% |
| Margin Growth (5Y Trend) ⓘ | -0.20% | 0.71% |
| FCF Growth (5Y CAGR) ⓘ | 11.76% | 11.01% |
| DPS Growth (5Y CAGR) ⓘ | 3.08% | 9.31% |
Quality (Business durability) | ||
| ROIC (Latest) ⓘ | N/A | 10.70% |
| ROA (Latest) ⓘ | 7.24% | 5.45% |
| ROIC (5Y Median) ⓘ | 22.23% | 9.33% |
| ROA (5Y Median) ⓘ | 4.20% | 4.94% |
| Net Debt / EBIT (Latest) ⓘ | 2.14 | 2.03 |
| Net Debt / EBIT (5Y Median) ⓘ | 2.94 | 2.28 |
| Net Debt / EBITDA (Latest) ⓘ | 1.48 | 1.37 |
| Net Debt / Assets ⓘ | 26.72% | 19.16% |
| EBITDA / Interest ⓘ | 9.18 | 9.73 |
| Operating Margin (Latest) ⓘ | 9.47% | 10.49% |
| Operating Margin (5Y Median) ⓘ | 8.87% | 10.30% |
| Debt to Equity (Latest) ⓘ | 187.23% | 65.91% |
| Profit Margin (Latest) ⓘ | 4.40% | 6.61% |
| Free Cash Flow (Latest) ⓘ | $1.95B | |
Momentum (Price trend) | ||
| 3Y Return ⓘ | +206.26% | +69.18% |
| 12M Return (excl. last month) ⓘ | +23.52% | +12.04% |
| 6M Return ⓘ | -4.34% | +0.22% |
| Price vs. 200-Day MA ⓘ | +31.92% | +0.19% |
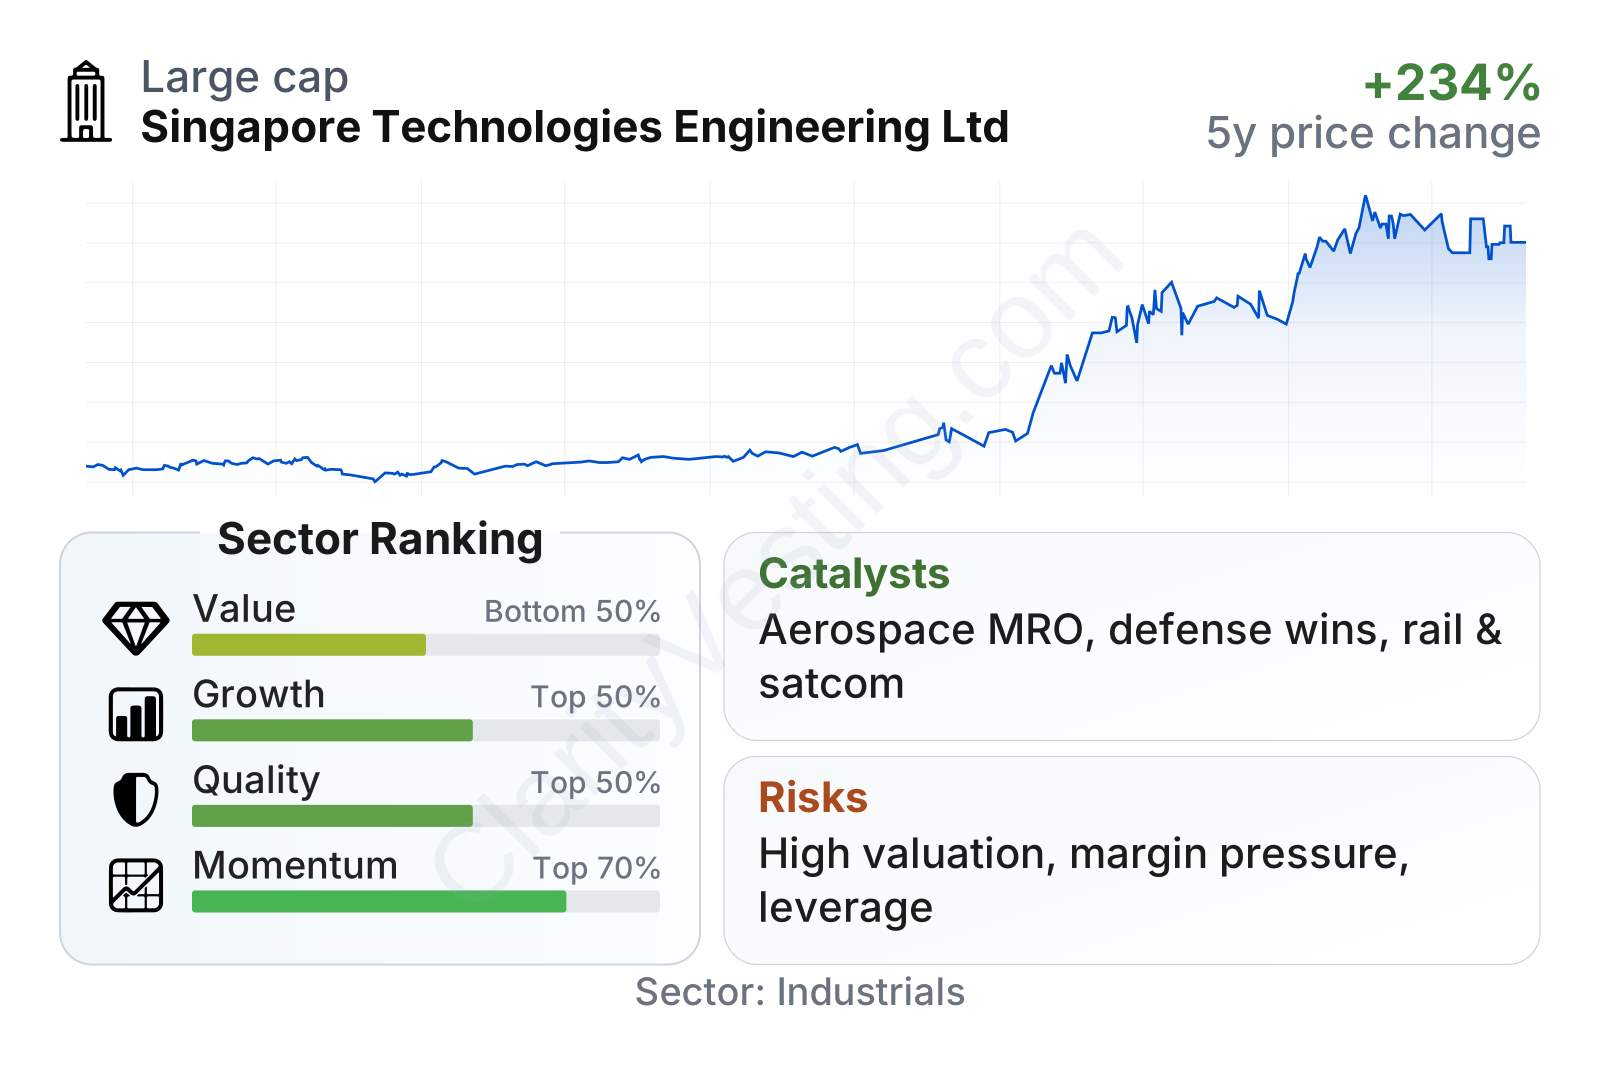
ST Engineering stands out as a large company in its sector with unusually low share-price volatility, reflected by a beta near 0.15. Growth metrics are generally better than the sector median, especially for revenue and free cash flow over multi-year periods. Quality is more mixed: returns on assets are solid and long-term return on invested capital has been strong, but margins are below sector medians and leverage is elevated, with debt-to-equity near 187%. Valuation metrics are also demanding, with earnings and book multiples far above typical sector levels, even though free cash flow yield and dividend yield remain comparatively respectable.
The share price performance has been especially strong over the last three years, rising far more than the typical industrial peer. That strength helps explain why valuation has expanded so much: the market has rewarded the company’s repositioning and contract visibility, but it now leaves less room for disappointment.
Growth
ST Engineering operates in several areas with favorable long-term demand drivers. Aerospace services continue to benefit from global air traffic recovery, aging fleets, and cargo conversion needs. Defense and public security spending remains supported by geopolitical tensions, modernization priorities, and the need for resilient digital systems. Urban Solutions and satcom are tied to rail upgrades, smart-city infrastructure, secure communications, and rising demand for connected transport networks. These are not short-lived themes, and they support a multi-year growth backdrop.
The company’s strategy also makes sense for this environment. It is combining service-heavy businesses that can generate recurring revenue with technology-led offerings in software, electronics, cyber, communications, and platform support. That combination can be valuable because governments and large infrastructure customers often prefer suppliers that can both build and maintain mission-critical systems. It also reduces dependence on one cycle alone.
A visible catalyst is the company’s order book and the nature of its customers. Large public-sector and transport contracts can create revenue visibility extending well beyond one year. ST Engineering has also invested in areas such as passenger-to-freighter conversions, satcom, digital rail, and defense electronics, where switching costs and certification requirements can support repeat business. In aerospace, demand for maintenance and conversion services can stay firm even when new aircraft deliveries are constrained.
Another encouraging point is that revenue growth has remained healthy, with recent year-over-year growth of about 11% and a five-year revenue-per-share growth rate above 12%, both ahead of the sector median. Free cash flow has also compounded at an annual pace near 12% over five years. That is important because it suggests the expansion is not only accounting-based; cash generation has also improved over time.
Recent corporate updates from company releases have continued to emphasize contract wins across defense, smart mobility, aerospace, and satellite communications. For a group like ST Engineering, these wins matter less as one-off headlines and more as evidence that demand remains broad across its main operating pillars.
Risks
This article is for informational purposes only and does not constitute financial advice. Some content is AI-generated. See Disclaimer


