Stock Analysis · Siegfried Holding AG (SGFEF)
Overview
Siegfried Holding AG is a Swiss pharmaceutical services company active in the healthcare sector. Rather than building a portfolio of its own blockbuster medicines, it mainly helps other drug companies develop and manufacture products. Its business spans both active pharmaceutical ingredients, which are the chemical or biological substances that make a medicine work, and finished dosage forms such as tablets, capsules, sterile injectables, and ophthalmic products. This makes Siegfried part of the broader contract development and manufacturing organization, or CDMO, market.
Its revenue base is diversified across pharmaceutical production activities, but the company does not usually disclose a very detailed public split in the simple way consumer businesses often do. Based on company reporting, the main economic drivers can be described as follows:
- Drug substance manufacturing and development: the largest revenue source. This includes development and commercial production of active ingredients for pharmaceutical customers, including complex chemistry and selected biologics-related capabilities.
- Drug product manufacturing and development: a major second source. This includes formulation, filling, finishing, and packaging of finished medicines such as oral solid doses and sterile products.
- Development services and other pharmaceutical support activities: a smaller but strategically important contribution tied to customer projects that can later move into commercial manufacturing.
Siegfried’s business model is attractive because customers often stay for years once a product is approved and running at commercial scale. That can create recurring revenue, but it also means capacity utilization, regulatory compliance, and customer concentration matter a great deal.
The profitability trend has generally improved over the last few years. Revenue has risen from a little above $1.1 billion in 2021 to roughly $1.33 billion in 2025, while operating income and net income have also moved higher overall despite some volatility in 2023. Gross profit has expanded faster than revenue, suggesting a somewhat better mix and operating discipline over time.
The business flow shows a company that has gradually expanded revenue while keeping operating profitability at a healthier level than many peers in healthcare manufacturing. The main pressure point is not the income statement as much as cash conversion, because recent free cash flow has turned negative even as accounting profits remained solid.
Key Figures
| Metric | Value | Sector ⓘ |
|---|---|---|
| Date | Oct 24, 2026 | |
| Context | ||
| Sector | Healthcare | |
| Industry | Drug Manufacturers - Specialty & Generic | |
| Market Cap ⓘ | $3.86B | |
| Beta ⓘ | 0.79 | |
Value (Cheapness) | ||
| P/E Ratio ⓘ | 17.87 | 25.42 |
| P/B Ratio ⓘ | 3.91 | 3.08 |
| FCF Yield ⓘ | -1.01% | 3.12% |
| Dividend Yield ⓘ | 0.45% | 1.85% |
| EBIT / EV ⓘ | N/A | 0.56% |
| PEG ⓘ | 1.35 | |
Growth (Business expansion) | ||
| Revenue Growth ⓘ | 2.20% | 7.50% |
| RPS Growth (5Y CAGR) ⓘ | -41.20% | 8.60% |
| EPS Growth (5Y CAGR) ⓘ | -29.01% | -17.73% |
| BVPS Growth (5Y CAGR) ⓘ | -36.49% | 3.72% |
| Margin Growth (5Y Trend) ⓘ | 4.01% | -0.57% |
| FCF Growth (5Y CAGR) ⓘ | 11.95% | 0.96% |
| DPS Growth (5Y CAGR) ⓘ | -39.88% | 6.69% |
Quality (Business durability) | ||
| ROIC (Latest) ⓘ | 32.94% | 3.17% |
| ROA (Latest) ⓘ | 15.01% | 2.98% |
| ROIC (5Y Median) ⓘ | 16.11% | 4.56% |
| ROA (5Y Median) ⓘ | 8.25% | 1.87% |
| Net Debt / EBIT (Latest) ⓘ | 1.96 | 1.34 |
| Net Debt / EBIT (5Y Median) ⓘ | 2.22 | 1.86 |
| Net Debt / EBITDA (Latest) ⓘ | 1.35 | 1.00 |
| Net Debt / Assets ⓘ | 33.95% | 5.06% |
| EBITDA / Interest ⓘ | 25.04 | 9.55 |
| Operating Margin (Latest) ⓘ | 15.86% | 9.25% |
| Operating Margin (5Y Median) ⓘ | 15.82% | 7.33% |
| Debt to Equity (Latest) ⓘ | 93.02% | 26.68% |
| Profit Margin (Latest) ⓘ | 12.78% | 3.34% |
| Free Cash Flow (Latest) ⓘ | -$38.85M | |
Momentum (Price trend) | ||
| 3Y Return ⓘ | +5.68% | +51.61% |
| 12M Return (excl. last month) ⓘ | -20.27% | +19.90% |
| 6M Return ⓘ | -11.42% | +10.10% |
| Price vs. 200-Day MA ⓘ | -5.59% | +6.44% |
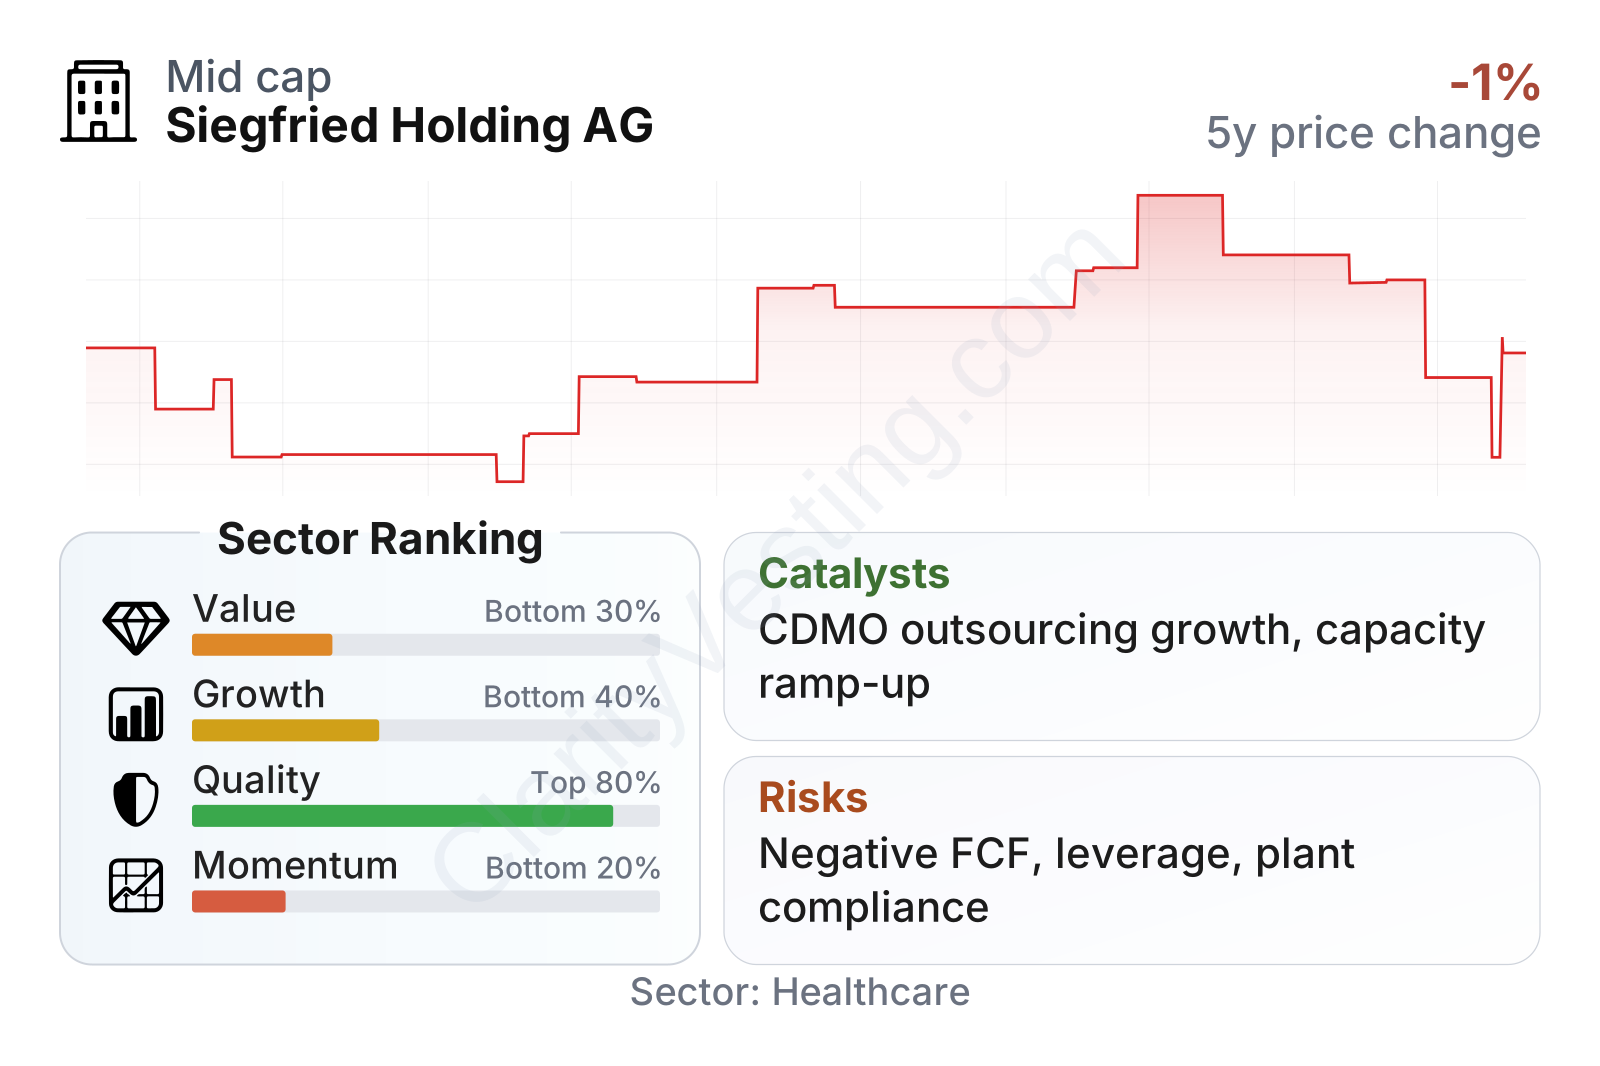
Siegfried stands out more on business quality than on headline growth or recent share performance. Profitability metrics are clearly above sector medians, with operating margin around the mid-teens and profit margin well ahead of many healthcare peers. Returns on capital and assets are also unusually strong for a manufacturing-heavy business. On the other hand, revenue growth has recently been modest, longer-term per-share growth metrics are weak, leverage is higher than the sector norm, and free cash flow is currently negative. Market behavior also reflects caution: the shares have lagged the sector over six months, twelve months, and three years.
Growth
Siegfried operates in a sector with favorable long-term foundations. Pharmaceutical outsourcing has grown as drug companies seek to reduce fixed costs, speed up development, manage technical complexity, and rely on specialized manufacturers for regulated production. This trend is especially relevant for companies that can handle both drug substances and finished dosage forms, because customers increasingly prefer partners able to support more of the value chain.
The company’s strategy broadly makes sense for future expansion. Siegfried has built an international production network and aims to combine high-quality manufacturing with specialized know-how in complex chemistry and dosage forms. In CDMO markets, scale alone is not enough; reliability, inspection readiness, and technical expertise often determine which suppliers win long contracts. Siegfried’s margins and returns suggest it has built a credible position in areas where customers are willing to pay for quality and consistency.
One of the strongest potential catalysts is the step-up from development work into commercial manufacturing. In this industry, a project that starts small can become materially larger once the customer’s drug is approved and launched. Capacity additions, better plant utilization, and onboarding of new molecules can therefore have an outsized effect on earnings. The company has also highlighted continued investment in expanding capabilities, which can support future revenue if demand remains healthy.
Recent operating trends also point to resilience. Revenue growth has been modest rather than explosive, but earnings recovery after the softer 2023 period suggests the business can improve performance through mix, utilization, and execution, not only through large top-line increases. That matters for a long-term view because this is a business where disciplined operations can be as important as raw sales growth.
Risks
This article is for informational purposes only and does not constitute financial advice. Some content is AI-generated. See Disclaimer


