Stock Analysis · Sgd Holdings Ltd (SGDH)
Overview
Sgd Holdings Ltd is classified in the financial services sector, but more specifically in the shell companies segment. In practical terms, that means it is not operating a large, diversified financial business with multiple established product lines. A shell company is generally a listed corporate structure that may hold limited operations while seeking transactions, restructurings, or other corporate developments that could reshape the business.
The available financial information shows a very small operating base relative to its stock market value. Revenue has been limited and inconsistent, and recent filings indicate that the company’s economic activity is narrow rather than broad-based. For a long-term reader, the key point is that this is not a conventional operating company with stable business lines that can be easily analyzed through normal revenue, margin, and market-share trends.
Based on the latest publicly visible financials, the company’s revenue sources are not meaningfully diversified enough to break down into a reliable multi-segment structure with credible percentages. The business appears to have a very limited revenue base, and recent results suggest that operating expenses have often exceeded revenue.
The broader flow of the business points to a sharp contraction since 2021: revenue fell from a modest level to a much smaller amount by 2024, while losses widened materially in 2024 before easing somewhat afterward. That pattern suggests that the listed entity currently derives more relevance from its corporate structure and potential future transaction value than from its present operating business.
The long-term trend is more important here than any single year: revenue has shrunk significantly, expenses have not translated into scale, and profitability has been weak or negative in most recent periods. This makes the company’s future highly dependent on strategic change rather than on steady business execution.
Key Figures
| Metric | Value | Sector ⓘ |
|---|---|---|
| Date | Oct 31, 2026 | |
| Context | ||
| Sector | Financial Services | |
| Industry | Shell Companies | |
| Market Cap ⓘ | $5.00B | |
| Beta ⓘ | 0.89 | |
Value (Cheapness) | ||
| P/E Ratio ⓘ | N/A | 12.20 |
| P/B Ratio ⓘ | N/A | 1.26 |
| FCF Yield ⓘ | -0.00% | 9.87% |
| Dividend Yield ⓘ | N/A | 2.87% |
| EBIT / EV ⓘ | N/A | 8.17% |
| PEG ⓘ | N/A | |
Growth (Business expansion) | ||
| Revenue Growth ⓘ | -56.50% | 8.40% |
| RPS Growth (5Y CAGR) ⓘ | -52.65% | 12.31% |
| EPS Growth (5Y CAGR) ⓘ | N/A | -4.03% |
| BVPS Growth (5Y CAGR) ⓘ | -62.47% | 4.96% |
| Margin Growth (5Y Trend) ⓘ | N/A | -4.14% |
| FCF Growth (5Y CAGR) ⓘ | -38.85% | 4.70% |
| DPS Growth (5Y CAGR) ⓘ | N/A | 8.85% |
Quality (Business durability) | ||
| ROIC (Latest) ⓘ | N/A | 9.35% |
| ROE (Latest) ⓘ | N/A | 13.95% |
| ROA (Latest) ⓘ | N/A | 1.57% |
| ROIC (5Y Median) ⓘ | N/A | 7.78% |
| ROE (5Y Median) ⓘ | N/A | 12.12% |
| ROA (5Y Median) ⓘ | -14.38% | 1.28% |
| Net Debt / EBIT (Latest) ⓘ | N/A | 0.99 |
| Net Debt / EBIT (5Y Median) ⓘ | N/A | 0.73 |
| Net Debt / EBITDA (Latest) ⓘ | N/A | 0.79 |
| Operating Margin (Latest) ⓘ | N/A | 22.61% |
| Operating Margin (5Y Median) ⓘ | -21.67% | 24.52% |
| Debt to Equity (Latest) ⓘ | -33.48% | 58.76% |
| Profit Margin (Latest) ⓘ | N/A | 26.18% |
| Free Cash Flow (Latest) ⓘ | -$11.43K | |
Momentum (Price trend) | ||
| 3Y Return ⓘ | -65.52% | +95.34% |
| 12M Return (excl. last month) ⓘ | +69.49% | +16.22% |
| 6M Return ⓘ | +0.01% | +7.41% |
| Price vs. 200-Day MA ⓘ | +0.78% | +5.48% |
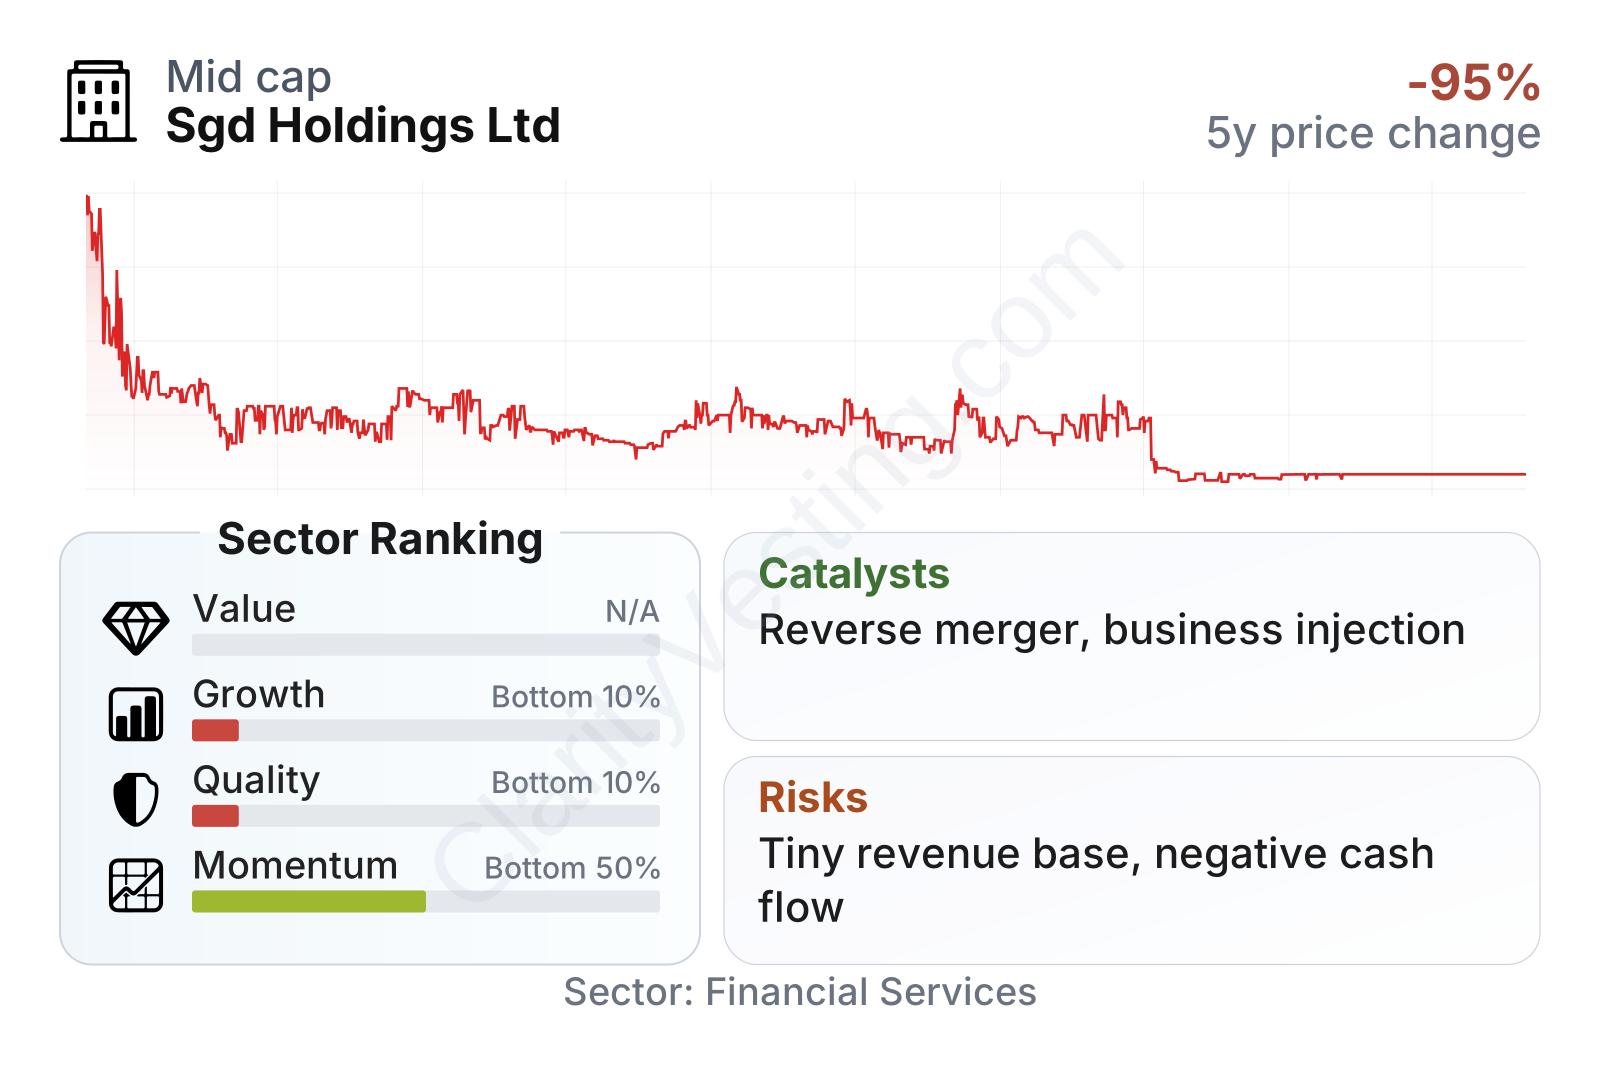
The overall profile is unusually weak on fundamentals. Growth and quality rank in the bottom 10% of the financial sector group, while momentum is mixed: the shares had a strong rebound over part of the last year, but the longer three-year record remains deeply negative. The company is also in a mid-sized market capitalization range despite having minimal revenue and negative free cash flow, which makes standard valuation comparisons hard to rely on.
The stock chart also shows a striking pattern: after a steep collapse from much higher levels in 2021 and 2022, the share price has drifted toward about $1.00 and stayed there for an extended period in 2026. That kind of behavior can happen when a stock’s trading is driven less by operating performance and more by corporate-event expectations, market structure, or listing-related dynamics.
Growth
The shell company space is not a growth sector in the usual sense. Unlike payments, asset management, or insurance technology, growth here does not come from steadily winning customers and expanding products. It usually comes from a major transaction: an acquisition, merger, recapitalization, or redirection of the business. That means future upside, if any, is tied more to strategic execution than to current operations.
At the moment, the company’s own operating trend does not support a strong organic growth case. Revenue declined by roughly 57% year over year, compared with positive sector growth for the median peer. Over five years, revenue per share and free cash flow have both moved sharply lower, and book value per share has also deteriorated materially. Those are signs of a business that has not been compounding underlying value through normal operations.
Earnings per share underscore that point. The company showed a small profit in 2021, then moved into losses, with results remaining weak afterward. There is no visible pattern yet of sustained earnings recovery that would normally support a long-term growth narrative based on business fundamentals.
Book value per share has remained negative, even though the deficit appears to have narrowed by 2025. That may be better than continued deterioration, but it still points to a fragile financial foundation. For long-term analysis, this matters because companies with negative book value and limited operating income often need a successful strategic reset before they can be assessed on more traditional growth metrics.
A meaningful catalyst would likely need to come from corporate activity rather than from the current business itself. If management completes a transaction that introduces a real operating company, injects assets, or creates a clearer business model, the market could begin valuing the company on a more conventional basis. Without that kind of event, the present numbers do not point to a strong self-sustaining expansion path.
Risks
This article is for informational purposes only and does not constitute financial advice. Some content is AI-generated. See Disclaimer


