Stock Analysis · Sofina Société Anonyme (SFNXF)
Overview
Sofina Société Anonyme is a Belgium-based investment company listed in Brussels and traded over the counter in the United States under the symbol SFNXF. Rather than operating a traditional industrial business, Sofina allocates capital into a portfolio of private and public companies around the world. Its focus is long-term compounding: it backs businesses through direct stakes, venture and growth investments, and commitments to specialized funds.
In practical terms, Sofina makes money mainly from changes in the value of its investment portfolio, dividend income received from portfolio companies, and gains realized when investments are sold. Because of that structure, yearly reported revenue and earnings can swing sharply with market conditions and valuation changes, even when the underlying portfolio is relatively stable operationally.
Based on Sofina’s reporting structure, its economic exposure is primarily organized by investment type rather than by a classic product-and-service revenue model. A simplified view of its main sources of value creation is:
- Direct long-term minority investments: the largest exposure, broadly around 50% to 60% of net asset value in recent reporting periods. This includes stakes in consumer, digital, education, healthcare, and other growth businesses.
- Private funds and venture/growth fund commitments: roughly 25% to 35%. This gives Sofina access to earlier-stage companies and managers it does not source directly.
- Listed investments and cash-related holdings: generally the smallest bucket, often around 10% to 20%, depending on market moves and deployment pace.
Sofina’s portfolio is also internationally diversified, with meaningful exposure to Europe, Asia, and the Americas. That matters because the company is not tied to one domestic economy; its results depend more on global private-market valuations, exit opportunities, and the execution of its investment teams.
One notable feature of the business model is its very low operating cost base relative to asset values. The financial flow over recent years shows that overhead has remained modest while reported profit has been driven mainly by portfolio revaluations and investment gains. That is typical for an investment holding company, but it also means reported income can look unusually strong in good years and weak in difficult ones.
Key Figures
| Metric | Value | Sector ⓘ |
|---|---|---|
| Date | Oct 17, 2026 | |
| Context | ||
| Sector | Financial Services | |
| Industry | Asset Management | |
| Market Cap ⓘ | $9.57B | |
| Beta ⓘ | 1.17 | |
Value (Cheapness) | ||
| P/E Ratio ⓘ | 6.02 | 12.26 |
| P/B Ratio ⓘ | 0.98 | 1.23 |
| FCF Yield ⓘ | 4.84% | 10.40% |
| Dividend Yield ⓘ | 1.35% | 3.02% |
| EBIT / EV ⓘ | N/A | 8.14% |
| PEG ⓘ | N/A | |
Growth (Business expansion) | ||
| Revenue Growth ⓘ | -34.50% | 9.35% |
| RPS Growth (5Y CAGR) ⓘ | -55.04% | 12.19% |
| EPS Growth (5Y CAGR) ⓘ | 6.39% | -9.53% |
| BVPS Growth (5Y CAGR) ⓘ | -5.42% | 4.99% |
| Margin Growth (5Y Trend) ⓘ | 94.18% | -3.86% |
| FCF Growth (5Y CAGR) ⓘ | N/A | 4.81% |
| DPS Growth (5Y CAGR) ⓘ | -1.13% | 8.79% |
Quality (Business durability) | ||
| ROIC (Latest) ⓘ | N/A | 9.49% |
| ROE (Latest) ⓘ | 16.24% | 13.90% |
| ROA (Latest) ⓘ | 14.74% | 1.55% |
| ROIC (5Y Median) ⓘ | 11.91% | 7.86% |
| ROE (5Y Median) ⓘ | 1.07% | 12.17% |
| ROA (5Y Median) ⓘ | 0.97% | 1.30% |
| Net Debt / EBIT (Latest) ⓘ | N/A | 0.96 |
| Net Debt / EBIT (5Y Median) ⓘ | N/A | 0.73 |
| Net Debt / EBITDA (Latest) ⓘ | 0.71 | 0.92 |
| Operating Margin (Latest) ⓘ | N/A | 22.30% |
| Operating Margin (5Y Median) ⓘ | 137.93% | 24.63% |
| Debt to Equity (Latest) ⓘ | 11.43% | 58.56% |
| Profit Margin (Latest) ⓘ | 93.88% | 26.57% |
| Free Cash Flow (Latest) ⓘ | $463.35M | |
Momentum (Price trend) | ||
| 3Y Return ⓘ | +39.19% | +88.33% |
| 12M Return (excl. last month) ⓘ | -5.45% | +19.38% |
| 6M Return ⓘ | +8.30% | +4.75% |
| Price vs. 200-Day MA ⓘ | +9.77% | +3.50% |
Sofina stands out as a large publicly traded investment holding company with a market value near $10 billion. The table points to a mixed profile: valuation multiples are below or near sector norms on earnings and book value, balance-sheet leverage is low, and profitability metrics are strong in the latest period. At the same time, growth readings are uneven because accounting results for an investment company are highly volatile, and the stock’s recent market performance has been weaker than much of the broader financial sector.
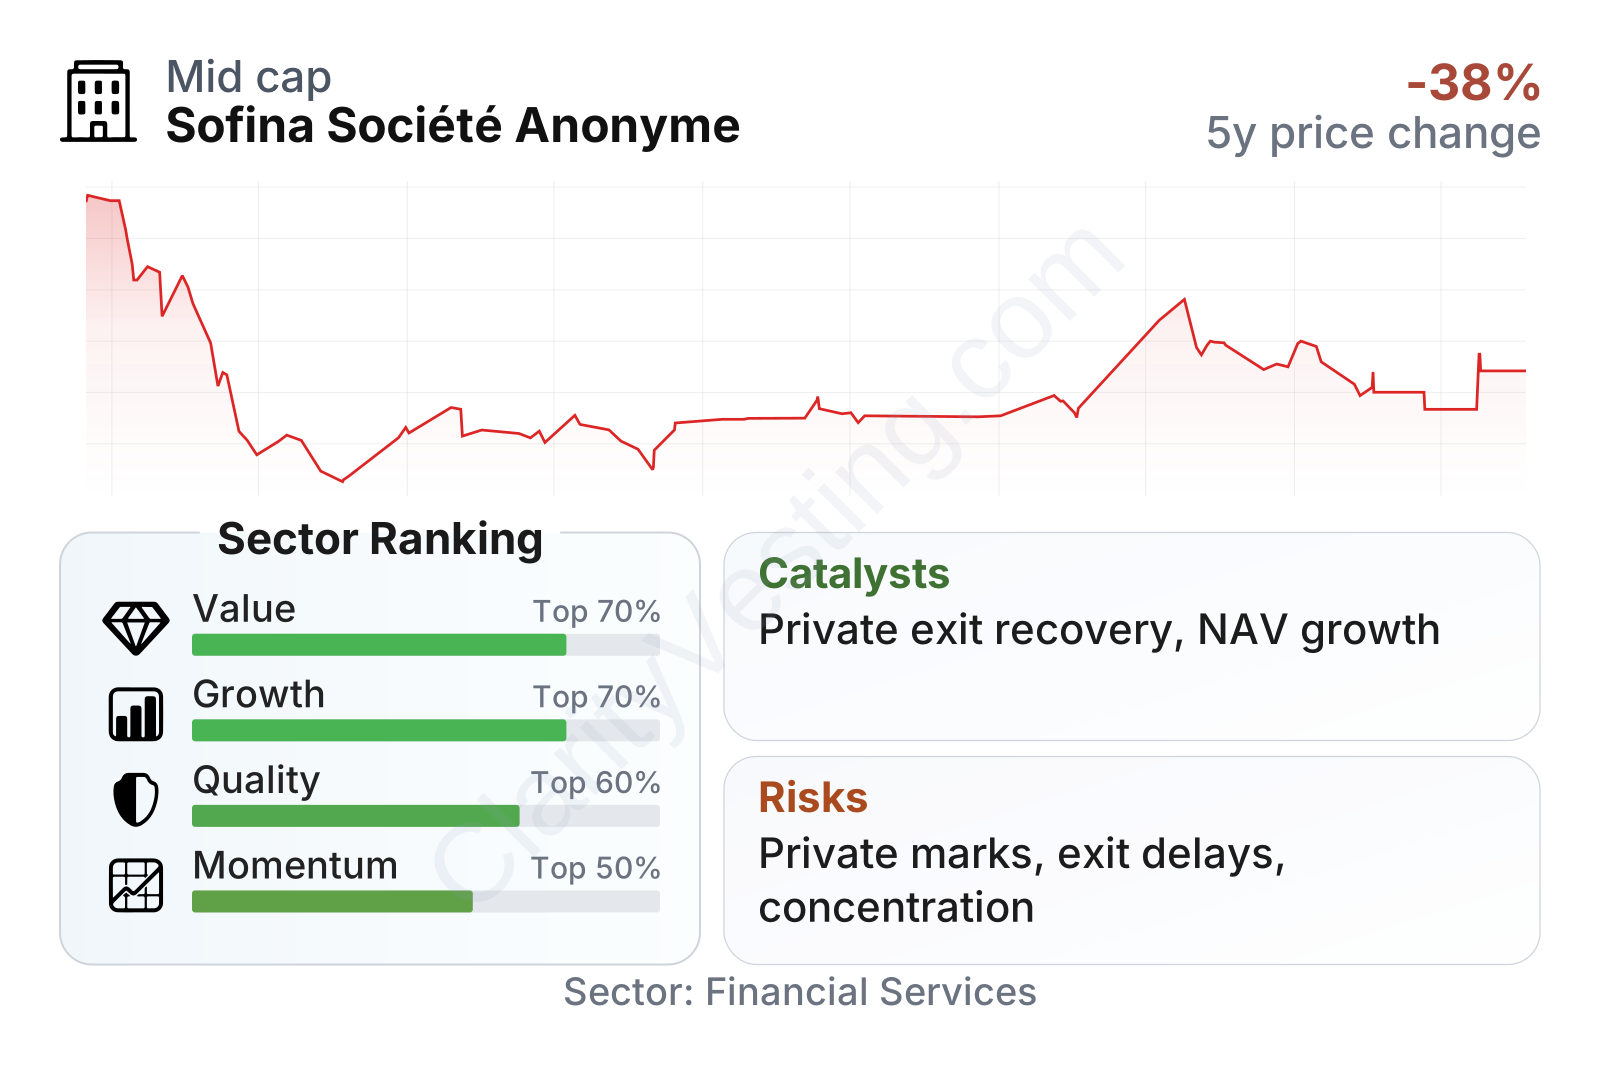
The share price history reflects that volatility. After trading at much higher levels in 2021, the stock corrected sharply and has only partly recovered. That pattern broadly matches what happened across many private-market and growth-oriented investment vehicles after interest rates rose and valuation multiples compressed.
Growth
Sofina operates in a part of the market that still has long-term tailwinds: private equity, venture capital, and growth investing remain important channels for financing digital platforms, healthcare innovation, education services, and consumer brands. Over long periods, these areas can expand faster than the general economy, especially when companies stay private for longer before an IPO or sale.
Sofina’s strategy also makes sense structurally. It combines direct investing with fund investing, which helps broaden sourcing and reduces dependence on a single theme or manager. The company has historically emphasized patient capital, family-controlled governance, and the ability to hold positions for many years. That approach can be valuable in private markets, where forced selling is often destructive and the best outcomes may take time to mature.
A major catalyst for future growth is recovery in private-market exits and valuation activity. When IPO markets, trade sales, and funding conditions improve, investment companies like Sofina have more opportunities to crystallize gains and recycle capital into new ideas. Sofina’s global reach and exposure to growth businesses could benefit meaningfully if that environment normalizes further.
The latest earnings per share reading is strong, but it should be read carefully. For Sofina, earnings are not as steady or predictable as they would be for an operating company selling products every quarter. They are heavily influenced by valuation marks and realized gains. That means a good EPS print may reflect genuine portfolio progress, but not necessarily a permanently higher earnings base.
Book value per share is especially important for a holding company like Sofina because it helps capture the underlying value of the portfolio over time. The trend here has been uneven: there was a major drop after the 2021 peak, some recovery afterward, and then another decline. This pattern suggests that the company has attractive assets, but their carrying value remains exposed to changing market sentiment and private valuation resets.
As for recent developments, the most significant opportunity is less about one headline and more about market conditions: improving financing markets, a healthier exit backdrop, and renewed confidence in private growth companies would all support Sofina’s model. The company’s continuing ability to invest across geographies and sectors also creates room for selective deployment if valuations become more favorable.
Risks
This article is for informational purposes only and does not constitute financial advice. Some content is AI-generated. See Disclaimer


