Stock Analysis · Simmons First National Corporation (SFNC)
Overview
Simmons First National Corporation is a regional bank holding company headquartered in Arkansas. Through Simmons Bank, it provides traditional banking services to individuals, small businesses, commercial clients, and public-sector customers across a multistate footprint in the South and Midwest. Its activities are centered on taking deposits, making loans, managing payments, and offering trust and wealth services.
Like most banks, Simmons does not generate revenue in the same way as an industrial company. Its largest earnings source is usually the spread between what it earns on loans and securities and what it pays on deposits and other funding. Based on recent annual reporting, the business can be understood through these main revenue drivers:
- Net interest income: about 75% to 85% of total revenue in a typical year. This is the core banking engine, built from commercial loans, real estate lending, consumer lending, and investment securities, minus interest paid on deposits and borrowings.
- Service charges, card fees, and deposit account fees: about 5% to 10%. This includes account-related charges, interchange income from debit and credit card usage, treasury management, and other transaction services.
- Wealth management, trust, brokerage, and mortgage-related fees: about 5% to 10%. These activities add non-interest income and make the business less dependent on interest rates alone.
- Other non-interest income: usually a low-single portion of total revenue. This can include gains or losses on securities, bank-owned life insurance income, and various smaller banking service lines.
The broad picture is that Simmons is still mainly a spread-based lender, not a fee-heavy financial platform. That makes loan quality, deposit costs, and interest-rate management especially important to long-term performance.
The revenue path over the last several years shows a clear pattern: total revenue expanded through 2024, but profitability tightened as funding costs and interest expense rose sharply. That pressure became severe enough to push recent reported profitability into a much weaker position than earlier years.
Key Figures
| Metric | Value | Sector ⓘ |
|---|---|---|
| Date | Oct 03, 2026 | |
| Context | ||
| Sector | Financial Services | |
| Industry | Banks - Regional | |
| Market Cap ⓘ | $3.26B | |
| Beta ⓘ | 0.91 | |
Value (Cheapness) | ||
| P/E Ratio ⓘ | N/A | 12.60 |
| P/B Ratio ⓘ | 0.95 | 1.23 |
| FCF Yield ⓘ | 14.74% | 10.16% |
| Dividend Yield ⓘ | 3.80% | 2.96% |
| EBIT / EV ⓘ | -12.37% | 7.77% |
| PEG ⓘ | 3.83 | |
Growth (Business expansion) | ||
| Revenue Growth ⓘ | 14.30% | 9.50% |
| RPS Growth (5Y CAGR) ⓘ | -11.82% | 12.10% |
| EPS Growth (5Y CAGR) ⓘ | -21.38% | -9.45% |
| BVPS Growth (5Y CAGR) ⓘ | -3.68% | 5.01% |
| Margin Growth (5Y Trend) ⓘ | -123.39% | -4.07% |
| FCF Growth (5Y CAGR) ⓘ | 16.47% | 4.96% |
| DPS Growth (5Y CAGR) ⓘ | 4.50% | 8.79% |
Quality (Business durability) | ||
| ROIC (Latest) ⓘ | -8.82% | 9.60% |
| ROE (Latest) ⓘ | -10.22% | 13.84% |
| ROA (Latest) ⓘ | -1.43% | 1.53% |
| ROIC (5Y Median) ⓘ | 3.78% | 7.86% |
| ROE (5Y Median) ⓘ | 5.23% | 12.20% |
| ROA (5Y Median) ⓘ | 0.64% | 1.29% |
| Net Debt / EBIT (Latest) ⓘ | N/A | 0.91 |
| Net Debt / EBIT (5Y Median) ⓘ | 2.49 | 0.74 |
| Net Debt / EBITDA (Latest) ⓘ | N/A | 0.97 |
| Operating Margin (Latest) ⓘ | -85.86% | 22.12% |
| Operating Margin (5Y Median) ⓘ | 14.95% | 24.39% |
| Debt to Equity (Latest) ⓘ | 37.32% | 60.37% |
| Profit Margin (Latest) ⓘ | N/A | 26.62% |
| Free Cash Flow (Latest) ⓘ | $480.96M | |
Momentum (Price trend) | ||
| 3Y Return ⓘ | +55.88% | +89.23% |
| 12M Return (excl. last month) ⓘ | +11.61% | +17.35% |
| 6M Return ⓘ | +19.03% | +10.00% |
| Price vs. 200-Day MA ⓘ | +8.27% | +3.73% |
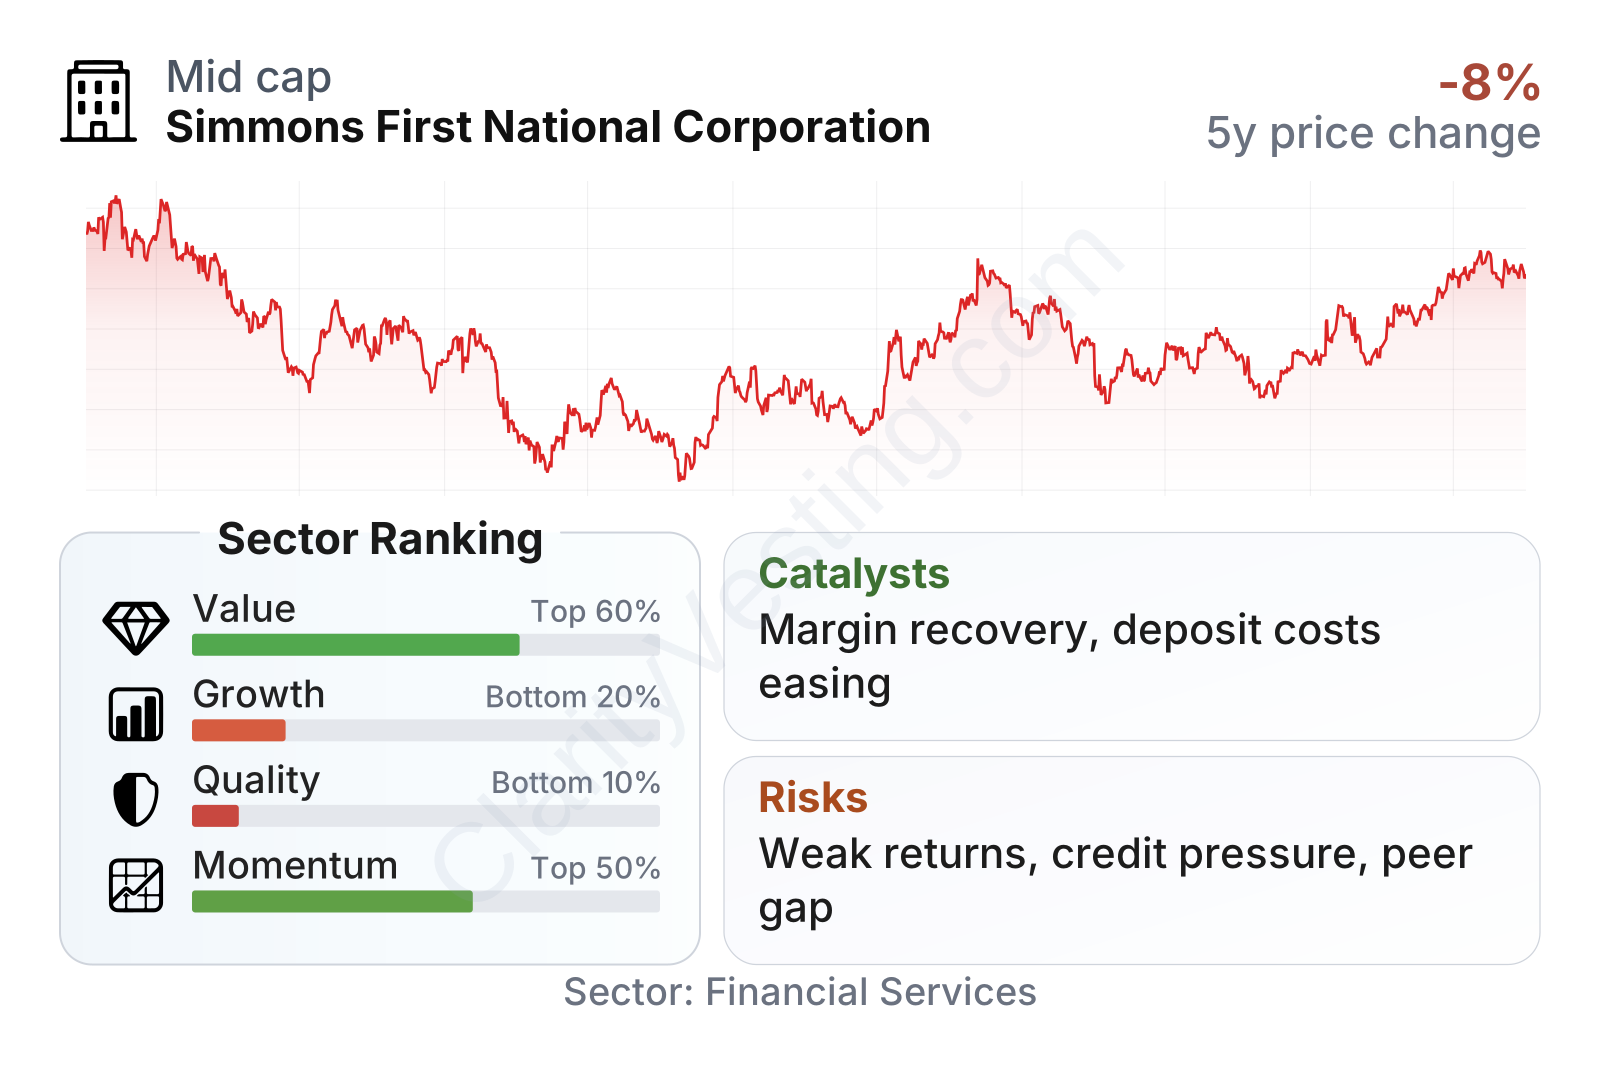
Simmons is a mid-sized regional bank with a market value in the low single-digit billions and a stock volatility slightly below the broader market. The mixed profile in the metrics table is important: value indicators look relatively attractive versus the regional bank group, while growth and quality indicators rank much weaker. In other words, the market is assigning a discount, but that discount comes with visible operating pressure rather than simple neglect.
The share price has recovered meaningfully from the lows seen during the 2023 regional banking stress and has continued improving into 2026. Even so, the longer arc still reflects a bank working through weaker profitability, not one that has already returned to peak earning power.
Growth
Regional banking is not a high-growth industry in the way software or semiconductors are, but it remains a necessary part of the economy. Demand for deposits, loans, treasury services, and wealth management tends to rise over time with population, business formation, and local economic activity. For Simmons, the key growth question is less about industry expansion and more about whether it can improve earnings power across its existing franchise.
The company’s strategy remains sensible on paper: focus on community and commercial banking, deepen customer relationships, maintain a meaningful branch presence in attractive regional markets, and add fee income through wealth and treasury services. This model can work well when deposit costs are stable and credit quality holds up. The challenge is that recent results show the bank has not translated that footprint into strong per-share growth.
Earnings per share have trended down materially from 2021 levels, with only a partial rebound more recently. That suggests that revenue growth alone has not been enough; margin pressure and credit-related costs have weighed on the bottom line. A durable improvement would likely require lower funding pressure, cleaner credit performance, and better operating efficiency rather than just loan growth for its own sake.
Book value per share has also been uneven, falling from earlier highs and then stabilizing before slipping again. For a bank, this matters because book value is both a capital cushion and a rough measure of franchise resilience. A flat or shrinking book value over several years limits the case for strong compounding unless profitability improves.
The clearest catalyst is a more normal banking environment. If deposit pricing stabilizes and the spread between asset yields and funding costs widens, Simmons could rebuild earnings without needing dramatic balance-sheet expansion. Another support is its diversified regional footprint, which reduces reliance on a single local economy. Public company updates in 2026 also point to ongoing balance-sheet management and efforts to improve returns, which is the right focus given the recent profit profile.
Risks
This article is for informational purposes only and does not constitute financial advice. Some content is AI-generated. See Disclaimer


