Stock Analysis · Peugeot Invest Société anonyme (SFFFF)
Overview
Peugeot Invest Société anonyme is a listed investment company rather than an operating business with one main product. Its role is to allocate capital across a portfolio of holdings, combining long-term strategic stakes in listed companies with investments in private equity funds, direct private companies, and co-investments. The group is closely associated with the Peugeot family and has gradually evolved from a vehicle-centered holding structure into a broader investment platform.
Because of that structure, its economic performance depends less on selling goods or services and more on the value, income, and exits generated by its investment portfolio. In practical terms, revenue can move sharply from one year to another depending on dividends received, asset disposals, revaluations, and the level of recurring income from holdings.
The main sources of economic contribution are generally the following:
- Listed equity holdings: typically the largest driver of net asset value. This includes major strategic stakes such as Peugeot 1810 and other listed investments. These holdings contribute through dividends and changes in market value.
- Private equity and direct private investments: an important second pillar, built through funds and direct positions in unlisted companies. This segment contributes through distributions, valuation changes, and occasional exits.
- Co-investments and thematic growth assets: a smaller but potentially faster-growing area, used to gain exposure to sectors such as technology, services, healthcare, and industrial innovation.
- Cash, treasury assets, and other financial income: usually the smallest contribution in normal periods, but it can support resilience and capital redeployment.
Unlike a traditional asset manager, Peugeot Invest does not mainly earn management fees from outside clients. It is primarily investing its own balance sheet. That makes the company easier to understand as a long-term capital allocator, but it also means results can be more volatile because they are tied to portfolio values and transaction timing.
Over recent years, the income profile has reflected that reality: reported revenue peaked above €400 million in 2022, then moved lower in 2023 and 2024, with another decline indicated for 2025. Even so, operating income stayed relatively solid, showing that the company’s portfolio model can remain profitable despite uneven top-line movements.
The business model converts a very high share of revenue into operating profit because this is a holding company with limited industrial costs. What stands out more than margin level is volatility: revenue has fluctuated materially over the last five years, while net income has also moved sharply from year to year depending on portfolio events, taxes, and realized gains.
Key Figures
| Metric | Value | Sector ⓘ |
|---|---|---|
| Date | Oct 17, 2026 | |
| Context | ||
| Sector | Financial Services | |
| Industry | Asset Management | |
| Market Cap ⓘ | $1.79B | |
| Beta ⓘ | 1.05 | |
Value (Cheapness) | ||
| P/E Ratio ⓘ | 10.82 | 12.26 |
| P/B Ratio ⓘ | 0.50 | 1.23 |
| FCF Yield ⓘ | 3.28% | 10.40% |
| Dividend Yield ⓘ | 4.52% | 3.02% |
| EBIT / EV ⓘ | N/A | 8.14% |
| PEG ⓘ | N/A | |
Growth (Business expansion) | ||
| Revenue Growth ⓘ | -40.60% | 9.35% |
| RPS Growth (5Y CAGR) ⓘ | -18.20% | 12.19% |
| EPS Growth (5Y CAGR) ⓘ | 1.83% | -9.53% |
| BVPS Growth (5Y CAGR) ⓘ | -13.33% | 4.99% |
| Margin Growth (5Y Trend) ⓘ | -45.64% | -3.86% |
| FCF Growth (5Y CAGR) ⓘ | N/A | 4.81% |
| DPS Growth (5Y CAGR) ⓘ | 4.37% | 8.79% |
Quality (Business durability) | ||
| ROIC (Latest) ⓘ | 5.33% | 9.49% |
| ROE (Latest) ⓘ | 7.46% | 13.90% |
| ROA (Latest) ⓘ | 4.73% | 1.55% |
| ROIC (5Y Median) ⓘ | 4.09% | 7.86% |
| ROE (5Y Median) ⓘ | 4.87% | 12.17% |
| ROA (5Y Median) ⓘ | 2.98% | 1.30% |
| Net Debt / EBIT (Latest) ⓘ | 5.93 | 0.96 |
| Net Debt / EBIT (5Y Median) ⓘ | 2.90 | 0.73 |
| Net Debt / EBITDA (Latest) ⓘ | 5.66 | 0.92 |
| Operating Margin (Latest) ⓘ | 15.30% | 22.30% |
| Operating Margin (5Y Median) ⓘ | 85.14% | 24.63% |
| Debt to Equity (Latest) ⓘ | 16.22% | 58.56% |
| Profit Margin (Latest) ⓘ | 91.33% | 26.57% |
| Free Cash Flow (Latest) ⓘ | $58.48M | |
Momentum (Price trend) | ||
| 3Y Return ⓘ | -25.18% | +88.33% |
| 12M Return (excl. last month) ⓘ | +4.44% | +19.38% |
| 6M Return ⓘ | +4.73% | +4.75% |
| Price vs. 200-Day MA ⓘ | +1.36% | +3.50% |
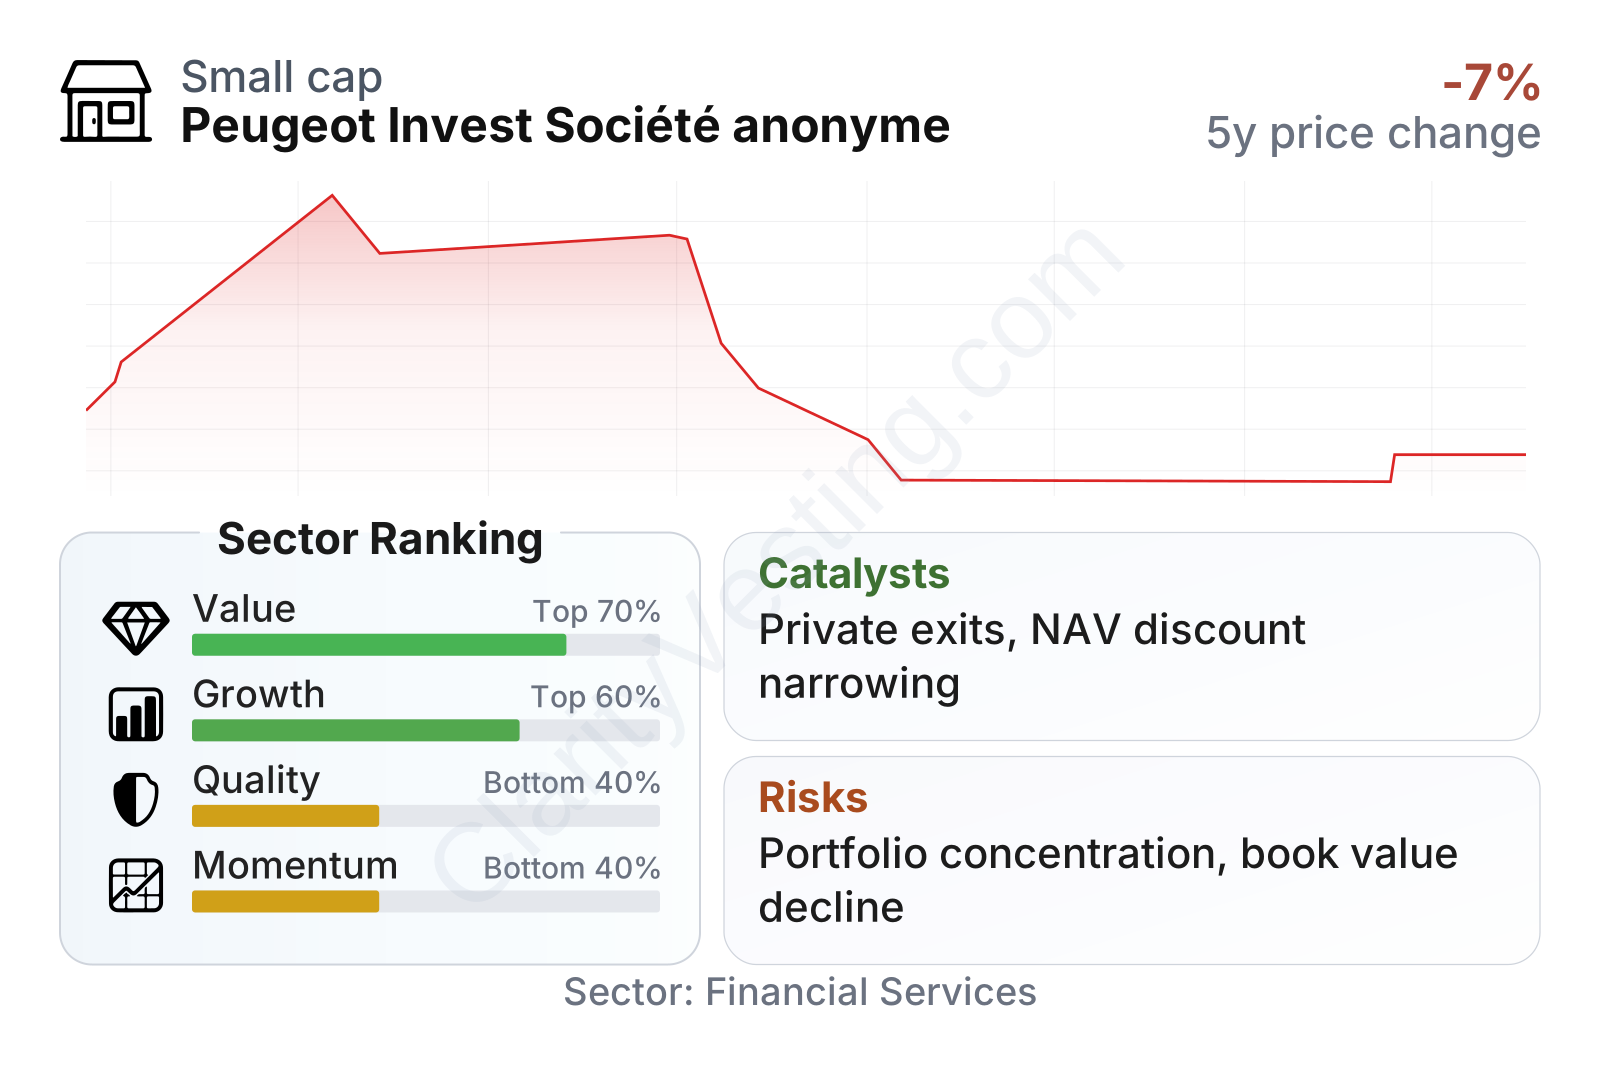
Peugeot Invest currently looks inexpensive on several traditional measures. The earnings multiple sits below the sector median, the price-to-book ratio is far below the sector norm, free cash flow yield is notably strong, and the dividend yield is above the sector median. That combination points to a market valuation that remains cautious despite healthy cash generation.
There are also some offsets. Quality metrics are mixed rather than outstanding: returns on equity and invested capital trail many peers, and leverage measured against EBIT is higher than the sector median even though balance-sheet debt remains modest relative to equity at roughly 14%. Share-price momentum has also been weak compared with the broader financial-services universe, which helps explain why the discount has persisted.
In size terms, Peugeot Invest is a relatively small listed financial company, with market behavior that can differ from much larger global asset managers or alternative investment groups. Its beta is close to 1, suggesting broad market sensitivity is fairly normal, but the stock’s lower liquidity can still amplify individual price moves.
Growth
Peugeot Invest operates in a part of the market that still has long-term tailwinds: private equity, long-duration family capital, and diversified listed-equity investing remain relevant as companies stay private for longer and institutional capital continues to seek specialized vehicles. The broader sector is therefore attractive, but Peugeot Invest’s growth path is different from a fee-based asset manager. It grows through portfolio appreciation, reinvestment discipline, and successful capital rotation rather than by gathering outside client assets.
The strategy makes sense for long-term expansion if management can keep broadening the portfolio away from single-name concentration while preserving the patience and balance-sheet strength that family-backed investment companies often use to their advantage. The logic is straightforward: use a stable capital base, avoid forced selling, and compound value through a mix of strategic holdings and private-market exposure.
That said, the recent growth record is uneven. Revenue fell sharply year over year, revenue per share has contracted over five years, and book value per share has also trended downward over that same period. Earnings per share growth over five years remains slightly positive, which suggests value creation has not disappeared, but it has been inconsistent rather than steadily compounding.
The earnings profile remains capable of producing solid per-share results in individual periods, but this should be read alongside the company’s inherently lumpy model. One strong EPS figure does not automatically mean a smooth earnings trend, especially for an investment holding company that can be affected by exits, distributions, and valuation changes.
Book value per share is especially important here because it is one of the clearest ways to track whether management is building long-term balance-sheet value. The decline over the past several years suggests that portfolio marks, distributions, and capital allocation have not yet translated into a steady upward compounding pattern. For a company of this type, that is a central point to watch.
A realistic catalyst would be a recovery in private-market realizations and a stronger valuation environment for holdings. Another would be successful exits or revaluations in private investments, especially if they help narrow the persistent gap between market price and underlying asset value. Continued portfolio diversification also matters, because reducing dependence on a narrower set of holdings could improve how the market assesses the business.
Risks
This article is for informational purposes only and does not constitute financial advice. Some content is AI-generated. See Disclaimer


