Stock Analysis · Seneca Foods Corp B (SENEB)
Overview
Seneca Foods is a U.S. packaged foods company focused mainly on shelf-stable and frozen vegetables, along with some fruit products. It processes produce grown by contracted farmers, packages it under owned brands and private-label programs, and sells through grocery retailers, foodservice channels, and other food distributors. The company is best known for canned vegetables, but its business is broader than that and is tied closely to everyday food consumption rather than discretionary spending.
Its revenue base is concentrated in vegetable and fruit products, with a meaningful role for retailer-owned brands. Based on recent annual disclosures, the business can be understood approximately as follows:
- Canned vegetables: about 45% to 55% of revenue. This includes core packaged vegetable lines sold under Seneca brands and customer private labels.
- Frozen vegetables: about 20% to 30% of revenue. These products serve both retail and foodservice customers.
- Fruit products: about 10% to 20% of revenue. This generally includes canned and packaged fruit categories.
- Snack chips and other food products: about 5% to 10% of revenue. This is a smaller but still relevant part of the portfolio.
- Other revenue: a small remaining share tied to miscellaneous food products, packaging-related items, and by-product activities.
What stands out is that Seneca is not built around fast-changing consumer trends or premium branding. It is built around scale, agricultural sourcing, food processing, and reliable distribution in staple categories. That usually means lower glamour, but it can also mean steadier underlying demand.
The business mix has recently become more favorable. Revenue has climbed to a new high, while gross profit and operating income have improved faster than sales. Interest expense also moved down sharply in the latest fiscal year, which helped more of each sales dollar reach net income.
Key Figures
| Metric | Value | Sector ⓘ |
|---|---|---|
| Date | Oct 10, 2026 | |
| Context | ||
| Sector | Consumer Defensive | |
| Industry | Packaged Foods | |
| Market Cap ⓘ | $1.22B | |
| Beta ⓘ | -0.03 | |
Value (Cheapness) | ||
| P/E Ratio ⓘ | 10.41 | 17.64 |
| P/B Ratio ⓘ | 1.59 | 1.27 |
| FCF Yield ⓘ | 18.82% | 12.68% |
| Dividend Yield ⓘ | N/A | 2.85% |
| EBIT / EV ⓘ | 10.51% | 6.32% |
| PEG ⓘ | 0.88 | |
Growth (Business expansion) | ||
| Revenue Growth ⓘ | 36.20% | 3.85% |
| RPS Growth (5Y CAGR) ⓘ | 11.10% | 6.20% |
| EPS Growth (5Y CAGR) ⓘ | -13.61% | -14.31% |
| BVPS Growth (5Y CAGR) ⓘ | 13.55% | 3.33% |
| Margin Growth (5Y Trend) ⓘ | 4.69% | -0.17% |
| FCF Growth (5Y CAGR) ⓘ | N/A | 4.37% |
| DPS Growth (5Y CAGR) ⓘ | 6.19% | 6.68% |
Quality (Business durability) | ||
| ROIC (Latest) ⓘ | 11.94% | 12.58% |
| ROA (Latest) ⓘ | 9.09% | 6.32% |
| ROIC (5Y Median) ⓘ | 7.13% | 10.38% |
| ROA (5Y Median) ⓘ | 4.88% | 5.44% |
| Net Debt / EBIT (Latest) ⓘ | 0.91 | 1.92 |
| Net Debt / EBIT (5Y Median) ⓘ | 3.74 | 2.32 |
| Net Debt / EBITDA (Latest) ⓘ | 0.71 | 1.36 |
| Net Debt / Assets ⓘ | 11.04% | 21.29% |
| EBITDA / Interest ⓘ | 12.34 | 9.52 |
| Operating Margin (Latest) ⓘ | 8.63% | 8.88% |
| Operating Margin (5Y Median) ⓘ | 5.62% | 9.53% |
| Debt to Equity (Latest) ⓘ | 29.22% | 71.95% |
| Profit Margin (Latest) ⓘ | 6.75% | 5.37% |
| Free Cash Flow (Latest) ⓘ | $229.66M | |
Momentum (Price trend) | ||
| 3Y Return ⓘ | +227.69% | +18.12% |
| 12M Return (excl. last month) ⓘ | +86.19% | +2.64% |
| 6M Return ⓘ | +21.75% | +1.32% |
| Price vs. 200-Day MA ⓘ | +19.25% | +0.17% |
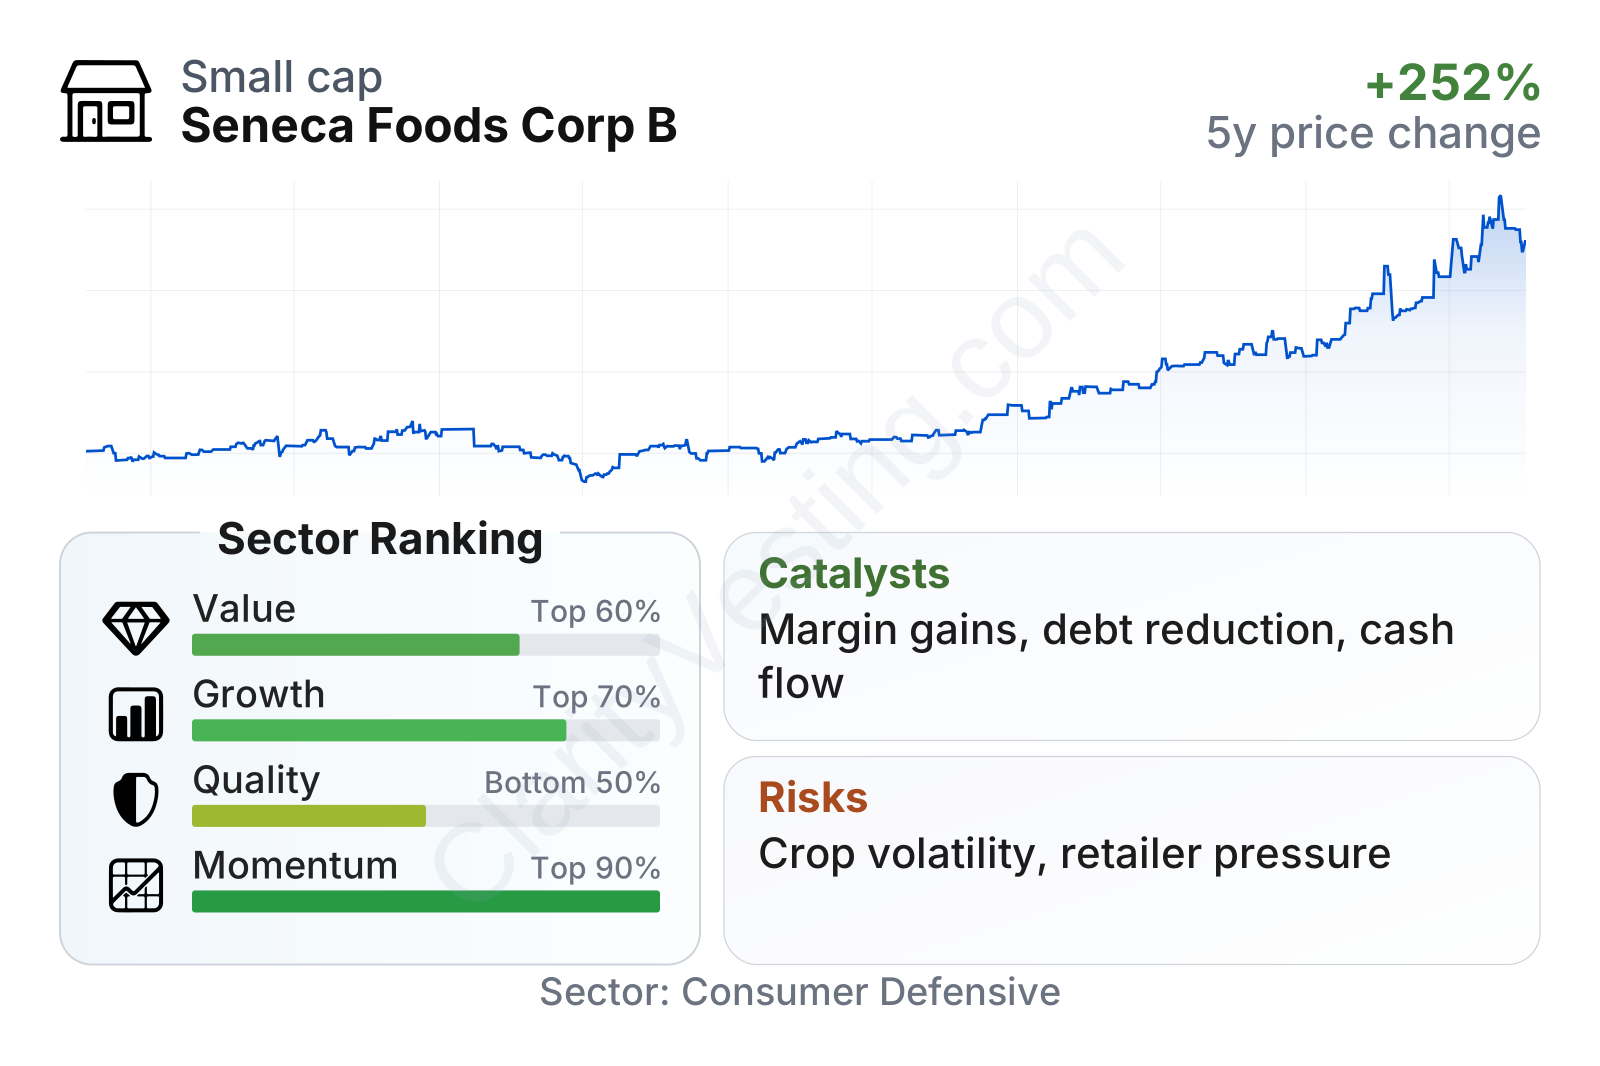
Seneca currently looks stronger on growth, cash generation, and market performance than on classic quality measures. Relative to the broader consumer defensive peer group, the valuation remains below the sector on earnings, while free cash flow yield and EBIT relative to enterprise value are notably stronger. The weaker area is long-term consistency: returns on capital and historical margins have been less impressive than the best operators in packaged foods, even though recent results have improved.
The stock chart shows a major re-rating over the last two years. Even after that rise, the company still screens at a lower earnings multiple than many sector peers. That combination usually means the market is recognizing better execution, but is still treating the business as cyclical and operationally uneven rather than assigning it a premium staple-food valuation.
Growth
Packaged foods is not a high-growth industry, but it is a durable one. Demand for canned and frozen vegetables tends to be supported by affordability, shelf life, and recurring household consumption. Those are useful traits in a market where consumers remain price-sensitive. Seneca’s focus on private label also fits a long-term retail trend: many supermarkets want value-oriented products that can compete with national brands on price while protecting retailer margins.
Seneca’s strategy for growth is practical rather than transformational. It is centered on operating efficiency, disciplined pricing, production scale, and serving both branded and private-label demand. That makes sense for this sector. The strongest path to growth is not likely to come from breakthrough innovation, but from better plant utilization, mix improvement, and maintaining customer relationships with large retailers and foodservice buyers.
Recent sales momentum has been clearly positive. Revenue growth has been uneven from quarter to quarter, which is normal in an agricultural processing business, but the latest reading is far above the sector median. Over a five-year period, revenue per share growth has also been ahead of many peers, suggesting that recent gains are not only a short one-quarter fluctuation.
Cash generation has improved dramatically after several years of pressure. Free cash flow moved from negative territory to strongly positive, even if the latest trailing figure is below the prior peak. For a processor of agricultural goods, that matters because working capital swings can be large. Positive free cash flow gives the company more flexibility to reduce debt, invest in capacity, or absorb input-cost volatility.
A meaningful recent catalyst is the improvement in profitability during fiscal 2026. Annual revenue reached roughly $1.66 billion, net income rose above $100 million, and interest expense declined materially from the prior year. That mix of higher sales, stronger margins, and lower financing costs is important because it suggests that earnings growth was not driven by just one temporary factor.
Risks
This article is for informational purposes only and does not constitute financial advice. Some content is AI-generated. See Disclaimer


