Stock Analysis · Seneca Foods Corp A (SENEA)
Overview
Seneca Foods Corp A is a U.S. packaged food company focused mainly on shelf-stable vegetables and fruit. Its business is built around processing, packaging, and distributing food products sold through supermarkets, food service channels, and private-label programs for retailers. The company is best known for canned vegetables, but it also sells frozen and snack-oriented products, along with some specialty items tied to its manufacturing network.
For long-term readers, this is a relatively specialized food manufacturer rather than a broad global consumer brand owner. That matters because Seneca’s results are influenced not only by consumer demand for pantry staples, but also by crop yields, agricultural costs, packaging inputs, and contract manufacturing relationships. The business can look defensive because people keep buying food in weak economies, yet its profitability can still move sharply when supply conditions change.
Based on company filings, Seneca’s revenue mix is concentrated in vegetables, with smaller contributions from fruit and other packaged food categories. The latest annual report describes the business through these broad product lines:
- Canned vegetables: approximately 60% to 70% of revenue. This includes shelf-stable vegetables sold under retailer brands and company-owned brands.
- Frozen vegetables: approximately 10% to 15% of revenue. This adds exposure to the frozen aisle and food service demand.
- Fruit products: approximately 10% to 15% of revenue. This generally includes canned and packaged fruit items.
- Snack and specialty products, and other: approximately 5% to 10% of revenue. This includes products such as snack chips and certain co-manufactured or specialty offerings.
Another useful way to view the company is by customer model rather than product form. A meaningful portion of sales comes from private-label and contract-packed products, which usually offer scale and recurring retailer relationships, but often carry lower brand power than premium branded food companies.
The business has recently shown a notable improvement in translating sales into profit. Revenue has moved higher over the last few fiscal years, but the bigger change has been the rebound in gross profit and operating income, suggesting that pricing, product mix, and cost control have improved after a weaker 2023 period.
The flow from sales to profit has become healthier in the most recent fiscal year. Revenue rose, but the more important shift was the expansion in gross profit and operating income, while interest expense eased from the prior year. That combination points to stronger operating efficiency and a lighter financing burden than during the company’s more leveraged period.
Key Figures
| Metric | Value | Sector ⓘ |
|---|---|---|
| Date | Oct 17, 2026 | |
| Context | ||
| Sector | Consumer Defensive | |
| Industry | Packaged Foods | |
| Market Cap ⓘ | $1.24B | |
| Beta ⓘ | -0.03 | |
Value (Cheapness) | ||
| P/E Ratio ⓘ | 10.57 | 17.88 |
| P/B Ratio ⓘ | 1.62 | 1.29 |
| FCF Yield ⓘ | 18.53% | 12.39% |
| Dividend Yield ⓘ | N/A | 2.85% |
| EBIT / EV ⓘ | 11.27% | 6.43% |
| PEG ⓘ | 0.83 | |
Growth (Business expansion) | ||
| Revenue Growth ⓘ | 36.20% | 4.10% |
| RPS Growth (5Y CAGR) ⓘ | 11.10% | 6.18% |
| EPS Growth (5Y CAGR) ⓘ | -13.62% | -13.59% |
| BVPS Growth (5Y CAGR) ⓘ | 13.55% | 3.20% |
| Margin Growth (5Y Trend) ⓘ | 4.69% | -0.15% |
| FCF Growth (5Y CAGR) ⓘ | N/A | 4.10% |
| DPS Growth (5Y CAGR) ⓘ | 6.19% | 6.79% |
Quality (Business durability) | ||
| ROIC (Latest) ⓘ | 11.94% | 12.34% |
| ROA (Latest) ⓘ | 9.09% | 6.30% |
| ROIC (5Y Median) ⓘ | 7.13% | 10.49% |
| ROA (5Y Median) ⓘ | 4.88% | 5.44% |
| Net Debt / EBIT (Latest) ⓘ | 0.91 | 1.96 |
| Net Debt / EBIT (5Y Median) ⓘ | 3.74 | 2.35 |
| Net Debt / EBITDA (Latest) ⓘ | 0.71 | 1.38 |
| Net Debt / Assets ⓘ | 11.04% | 21.51% |
| EBITDA / Interest ⓘ | 12.34 | 9.46 |
| Operating Margin (Latest) ⓘ | 8.63% | 8.87% |
| Operating Margin (5Y Median) ⓘ | 5.62% | 9.53% |
| Debt to Equity (Latest) ⓘ | 29.22% | 72.35% |
| Profit Margin (Latest) ⓘ | 6.75% | 5.40% |
| Free Cash Flow (Latest) ⓘ | $229.66M | |
Momentum (Price trend) | ||
| 3Y Return ⓘ | +241.80% | +20.92% |
| 12M Return (excl. last month) ⓘ | +74.16% | +2.13% |
| 6M Return ⓘ | +11.40% | +1.26% |
| Price vs. 200-Day MA ⓘ | +19.01% | +1.39% |
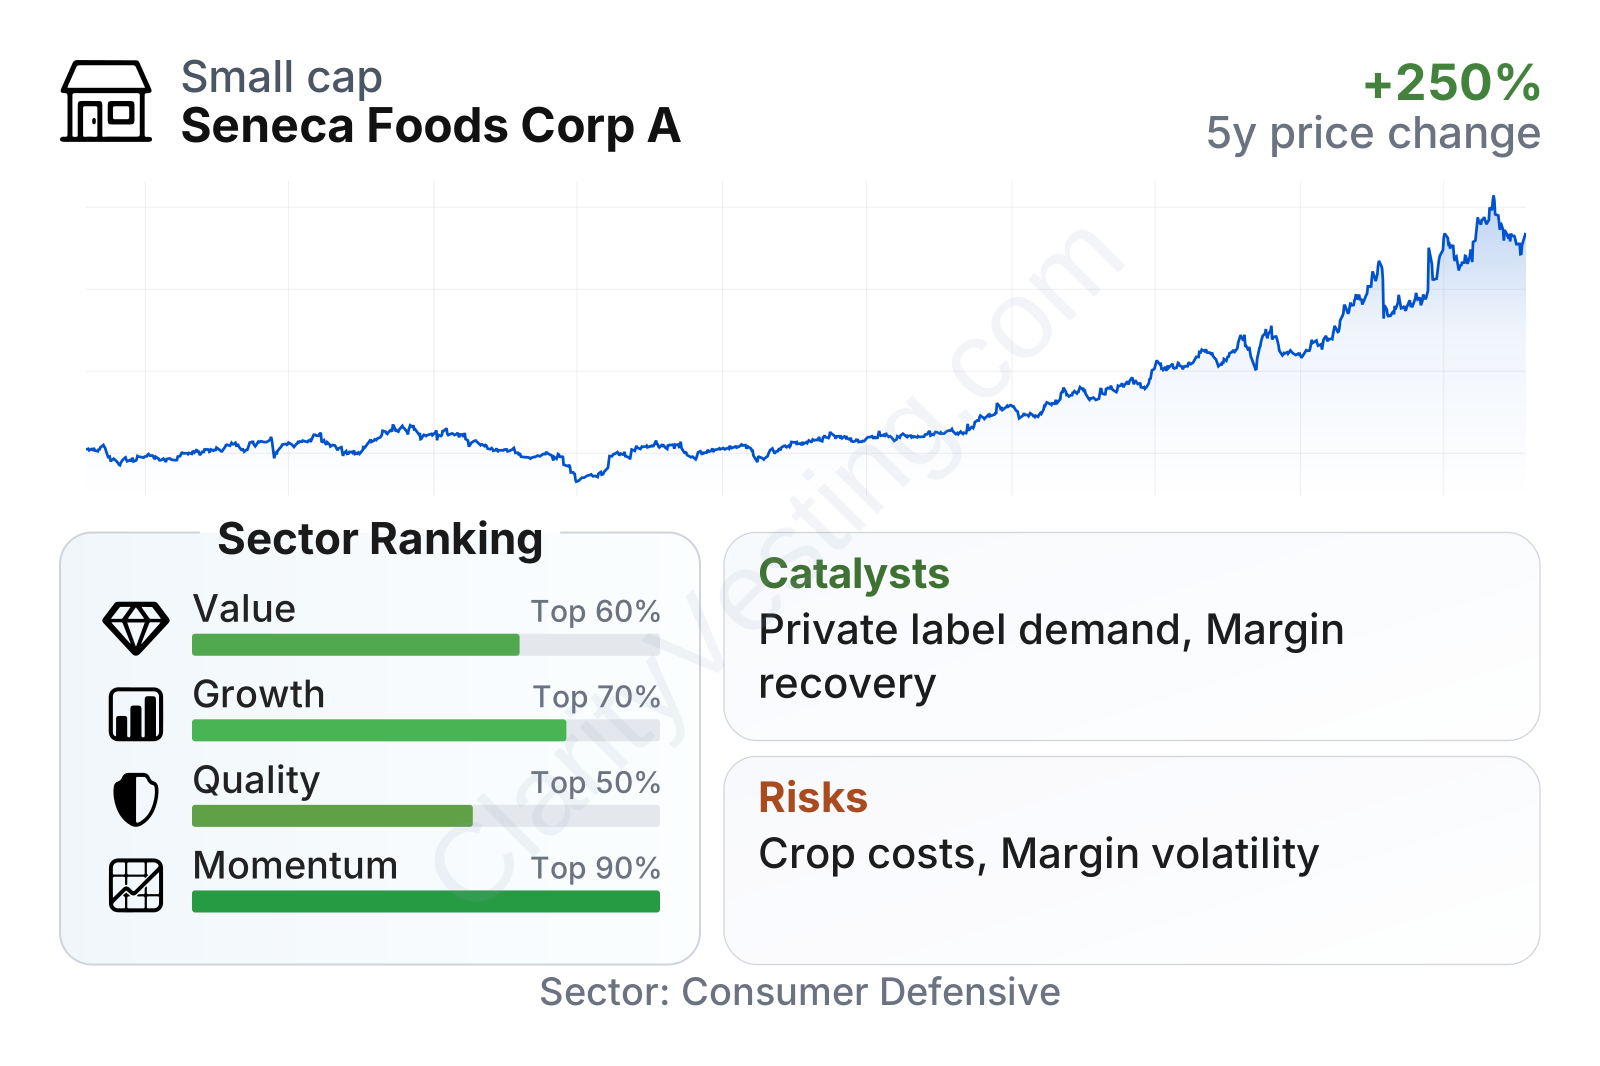
Seneca sits in the mid-sized range within public food stocks, and its recent profile is unusual for a packaged food name: strong momentum, solid profitability, and low leverage, paired with a valuation that still looks below many sector peers on earnings. The table also suggests that growth has improved faster than the industry median, while quality is respectable rather than exceptional over a full cycle because historical margins were less consistent.
The share price has climbed dramatically over the last three years, with especially strong gains during 2025 and 2026. Even after that run, the earnings multiple remains below the sector median, which implies the market is still treating part of the recent performance as potentially cyclical rather than fully permanent.
Growth
Packaged foods is generally a mature sector, not a high-growth one. Demand for canned and frozen staples tends to grow slowly over time, often roughly in line with population, pricing, and changes in retailer mix. That means Seneca’s long-term expansion case does not depend on a booming industry. Instead, it depends on executing well in a stable category: winning retailer shelf space, managing crops and production efficiently, and converting commodity-heavy operations into dependable cash generation.
That strategy currently looks sensible. Seneca’s private-label and value-oriented positioning can work well in periods when consumers remain price-conscious and retailers want dependable lower-cost offerings. In food categories where branding matters less than availability, quality consistency, and price, scale manufacturing can be a real advantage.
Recent sales growth has been much stronger than what is typical in consumer staples. Revenue growth was uneven for a while, including some negative quarters, but the latest period shows a sharp acceleration and stands well above the sector median. For a company in canned and frozen foods, that kind of jump usually reflects a mix of pricing, volume recovery, and favorable product timing rather than a structural transformation of the category. Still, it shows that Seneca is currently operating from a position of strength.
Cash generation has improved meaningfully. Free cash flow was negative in earlier periods, then turned strongly positive, and remains at a healthy level. For a company tied to inventories, seasonal working capital, and agricultural cycles, that swing matters. It suggests the recent earnings improvement is not only an accounting effect but has also started to show up in actual cash.
One of the clearest catalysts is the company’s stronger financial flexibility. Lower leverage and better cash flow create room for debt reduction, plant investment, and working-capital support during crop cycles. Another potential tailwind is retailer demand for private-label food, which can stay resilient when households trade down to lower-priced pantry staples. Seneca also benefits from operating in categories with repeat consumption and long shelf life, which can make order patterns more stable than in discretionary food niches.
Recent company reporting also points to improved profitability and a stronger balance sheet compared with the pressure seen a few years ago. That does not guarantee smooth future growth, but it does increase the company’s capacity to absorb normal volatility and keep investing in its processing network.
Risks
This article is for informational purposes only and does not constitute financial advice. Some content is AI-generated. See Disclaimer


