Stock Analysis · SEI Investments Company (SEIC)
Overview
SEI Investments Company is a financial services firm focused on investment processing, asset management, and technology platforms for institutions and advisors. In simple terms, it helps banks, wealth managers, investment advisors, retirement plan providers, and institutional investors run the operational side of investing while also offering investment products and portfolio solutions. Its model combines software-like recurring platform revenue with fees tied to client assets, which makes the business partly operational and partly market-sensitive.
SEI operates through several client-focused segments, including private banks, investment advisors, institutional investors, investment managers, and private wealth clients. It also has an investments business that includes mutual funds, pooled vehicles, and other managed solutions. The mix matters because it gives the company multiple ways to earn revenue instead of relying on a single customer type.
Based on recent company filings, SEI’s revenue primarily comes from asset-based fees, administration and distribution fees, and outsourcing or technology-related service fees. Exact percentages can shift with market levels and client activity, but the revenue structure is broadly concentrated in recurring service and asset-linked fees.
- Asset management and asset-based fees: approximately 45% to 55% of revenue. These fees are tied to assets under management or administration and include investment management, advisory programs, and portfolio solutions.
- Administration, processing, and platform services: approximately 30% to 40% of revenue. This includes back-office processing, custody-related support, reporting, fund administration, and outsourced investment operations.
- Distribution and shareholder servicing fees: approximately 10% to 20% of revenue. These are linked to the distribution and servicing of investment products and investor accounts.
- Other revenue: a smaller portion from transaction-based activity, consulting, and miscellaneous service arrangements.
One notable financial trend is that revenue has climbed from roughly $1.9 billion in 2021 to about $2.3 billion in 2025, while net income has also expanded meaningfully after a softer period in 2022 and 2023. That suggests the company has been able to translate stronger markets, business wins, and operating leverage into improved profitability.
The business mix shows a company with strong gross profitability and rising operating income over the last two years. Costs have grown, but revenue and profit have grown faster, which points to good scalability when markets and client asset levels are supportive.
Key Figures
| Metric | Value | Sector ⓘ |
|---|---|---|
| Date | Oct 24, 2026 | |
| Context | ||
| Sector | Financial Services | |
| Industry | Asset Management | |
| Market Cap ⓘ | $13.01B | |
| Beta ⓘ | 0.97 | |
Value (Cheapness) | ||
| P/E Ratio ⓘ | 19.12 | 12.46 |
| P/B Ratio ⓘ | 5.07 | 1.25 |
| FCF Yield ⓘ | 5.30% | 9.82% |
| Dividend Yield ⓘ | 0.97% | 2.94% |
| EBIT / EV ⓘ | 8.30% | 8.11% |
| PEG ⓘ | 1.71 | |
Growth (Business expansion) | ||
| Revenue Growth ⓘ | 14.70% | 9.10% |
| RPS Growth (5Y CAGR) ⓘ | 8.19% | 12.31% |
| EPS Growth (5Y CAGR) ⓘ | 6.15% | -6.97% |
| BVPS Growth (5Y CAGR) ⓘ | 7.75% | 5.02% |
| Margin Growth (5Y Trend) ⓘ | 6.90% | -4.00% |
| FCF Growth (5Y CAGR) ⓘ | 0.19% | 4.71% |
| DPS Growth (5Y CAGR) ⓘ | 7.73% | 8.92% |
Quality (Business durability) | ||
| ROIC (Latest) ⓘ | 27.24% | 9.18% |
| ROE (Latest) ⓘ | 30.22% | 13.93% |
| ROA (Latest) ⓘ | 21.24% | 1.57% |
| ROIC (5Y Median) ⓘ | 23.99% | 7.80% |
| ROE (5Y Median) ⓘ | 26.51% | 12.15% |
| ROA (5Y Median) ⓘ | 22.33% | 1.28% |
| Net Debt / EBIT (Latest) ⓘ | -0.38 | 1.02 |
| Net Debt / EBIT (5Y Median) ⓘ | -1.36 | 0.72 |
| Net Debt / EBITDA (Latest) ⓘ | -0.38 | 0.88 |
| Operating Margin (Latest) ⓘ | 34.95% | 22.30% |
| Operating Margin (5Y Median) ⓘ | 28.89% | 24.50% |
| Debt to Equity (Latest) ⓘ | 1.82% | 59.34% |
| Profit Margin (Latest) ⓘ | 28.85% | 26.42% |
| Free Cash Flow (Latest) ⓘ | $690.15M | |
Momentum (Price trend) | ||
| 3Y Return ⓘ | +98.43% | +95.73% |
| 12M Return (excl. last month) ⓘ | +20.59% | +17.30% |
| 6M Return ⓘ | +23.97% | +6.07% |
| Price vs. 200-Day MA ⓘ | +13.39% | +5.36% |
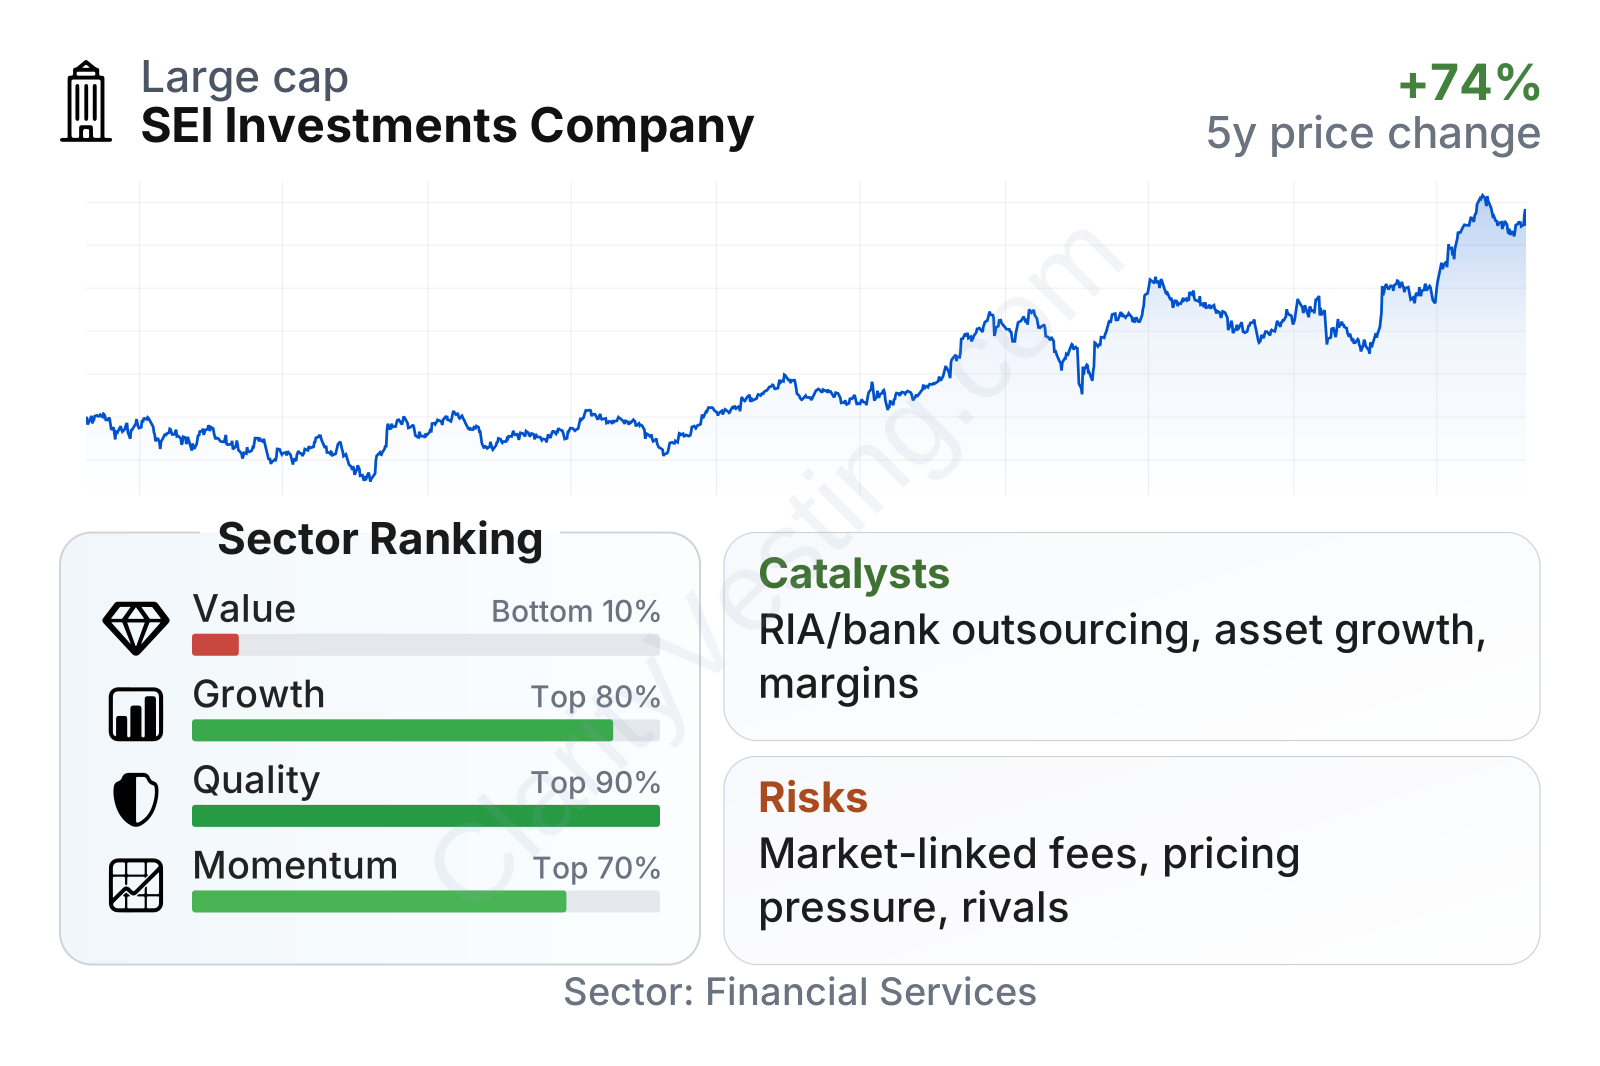
SEI is a mid-sized financial services company with a market value around $12.6 billion and a share price pattern that has been volatile but clearly upward over the last several years. The stock’s beta is close to 1, which means it has generally moved in line with the broader market rather than behaving like an unusually defensive or unusually aggressive name.
The quality profile stands out the most. Profitability ratios are far above sector medians, with return on equity near 31%, return on assets near 23%, and operating margin around 35%. The balance sheet is also unusually clean for a financial company, with debt to equity of about 3% and net cash rather than net debt. That combination of high returns and low leverage is uncommon.
Growth metrics are mixed but generally solid. Recent year-over-year revenue growth has been stronger than the sector median, and book value per share has compounded at a healthy pace over five years. Earnings growth over five years has been uneven, but the comparison still looks better than much of the sector, where many firms have also faced pressure from market swings and fee compression.
Valuation metrics are the weaker part of the picture. The stock trades above sector medians on both earnings and book value multiples, while dividend yield and free cash flow yield are below the typical financial services peer. In other words, the market is already assigning a premium to SEI’s business quality.
Growth
SEI operates in a part of financial services that has long-term structural support. Wealth management outsourcing, retirement administration, investment operations modernization, and demand for integrated technology platforms have all been growing themes. Financial institutions continue to look for ways to cut costs, automate manual processes, and handle rising regulatory complexity. That environment fits SEI’s core offering well.
The company’s strategy also makes practical sense for future growth. Instead of being only an asset manager, SEI combines administration, custody-related services, investment operations, advisor platforms, and investment products. This creates stickier client relationships because a customer using multiple parts of the platform is less likely to switch providers. It also gives SEI room to grow within existing accounts, not just by adding new clients.
Its business is helped by two built-in growth engines. First, higher client asset balances can lift fee revenue without requiring the same pace of cost growth. Second, outsourcing demand from banks, RIAs, asset managers, and institutional clients can expand even in periods when markets are less favorable, because firms still need to improve efficiency.
Earnings per share show that SEI went through a flatter period in 2022 and 2023, then recovered strongly in 2024 and 2025. That pattern is important: it suggests the company is not a straight-line grower, but it can produce meaningful earnings expansion when market conditions and operating execution align.
Book value per share has trended steadily upward over the last five years, which supports the idea that SEI has been compounding shareholder capital even through uneven markets. That steady increase is often a useful sign for financial businesses because it reflects retained profitability and balance-sheet growth over time.
Recent company updates have also pointed to continued investment in platform capabilities and client solutions. For a company like SEI, major opportunities usually do not come from a single headline event. They tend to come from cumulative wins: onboarding new clients, expanding outsourced mandates, gathering more assets onto existing platforms, and benefiting from favorable equity markets that lift asset-based fees.
Risks
This article is for informational purposes only and does not constitute financial advice. Some content is AI-generated. See Disclaimer


