Stock Analysis · Sembcorp Industries Ltd (SCRPF)
Overview
Sembcorp Industries Ltd is a Singapore-based utilities and energy infrastructure group. Over the past several years, it has been reshaping itself away from a broader conglomerate model and toward a cleaner, more focused portfolio centered on renewables, conventional power, urban and water solutions, and energy-related infrastructure. In simple terms, the company develops, owns, and operates assets that help supply electricity, steam, water, and environmental services to businesses, governments, and communities across Asia and other selected markets.
The business is most closely tied to two big themes: the need for reliable power in fast-growing Asian markets, and the long-term shift toward lower-carbon energy systems. Sembcorp’s portfolio includes solar, wind, energy storage, gas-fired power, and integrated utilities supplied to industrial customers. It also has urban development activities, although the group today is much more identified with energy and utilities than with land development.
Based on recent company reporting, the main revenue sources are broadly split as follows:
- Gas and related services: approximately 44% of group revenue. This includes natural gas sales and related energy activities, mainly in Singapore.
- Wholesale electricity, retail electricity, and other integrated market activities: approximately 24% of revenue. This covers power sales into wholesale markets and sales to commercial and industrial users.
- Renewables and other energy-related segments: approximately 15% of revenue. This includes solar, wind, and other low-carbon generation activities, though renewables often contribute a larger share of strategic value than of reported revenue.
- Waste, water, and integrated urban solutions: approximately 9% of revenue. These activities include water treatment, wastewater, and environmental services for industrial sites and municipalities.
- Urban development and other businesses: approximately 8% of revenue. This includes contributions from township and industrial park development, as well as smaller corporate and other activities.
One important point for long-term readers is that revenue does not always show where value is created. In utilities, regulated assets, long-term contracts, and high-margin operating platforms can matter more than raw sales. Sembcorp’s recent earnings mix has increasingly reflected that dynamic, with stronger profit contribution from its renewables and integrated utilities platform.
The broad financial flow over the last several years shows a business that has improved profitability even as revenue has become lower than the 2022 peak. That suggests a better mix of activities and stronger operating discipline rather than simple volume growth.
The business appears to have become more efficient: revenue has moderated since 2022, but operating income and net income remained much stronger than earlier years, indicating that Sembcorp has been shifting toward better-quality earnings.
Key Figures
| Metric | Value | Sector ⓘ |
|---|---|---|
| Date | Oct 17, 2026 | |
| Context | ||
| Sector | Utilities | |
| Industry | Utilities - Diversified | |
| Market Cap ⓘ | $8.37B | |
| Beta ⓘ | 0.06 | |
Value (Cheapness) | ||
| P/E Ratio ⓘ | 18.08 | 17.28 |
| P/B Ratio ⓘ | 1.64 | 1.51 |
| FCF Yield ⓘ | -0.45% | 0.65% |
| Dividend Yield ⓘ | 5.74% | 3.77% |
| EBIT / EV ⓘ | N/A | 5.01% |
| PEG ⓘ | 2.81 | |
Growth (Business expansion) | ||
| Revenue Growth ⓘ | 28.20% | 6.10% |
| RPS Growth (5Y CAGR) ⓘ | -2.39% | 3.87% |
| EPS Growth (5Y CAGR) ⓘ | 23.05% | -11.30% |
| BVPS Growth (5Y CAGR) ⓘ | 8.59% | 4.23% |
| Margin Growth (5Y Trend) ⓘ | 19.04% | 3.57% |
| FCF Growth (5Y CAGR) ⓘ | -36.83% | -8.84% |
| DPS Growth (5Y CAGR) ⓘ | 44.27% | 4.84% |
Quality (Business durability) | ||
| ROIC (Latest) ⓘ | 12.27% | 6.53% |
| ROA (Latest) ⓘ | 7.32% | 3.20% |
| ROIC (5Y Median) ⓘ | 8.23% | 5.95% |
| ROA (5Y Median) ⓘ | 5.58% | 2.75% |
| Net Debt / EBIT (Latest) ⓘ | 6.04 | 7.13 |
| Net Debt / EBIT (5Y Median) ⓘ | 6.07 | 7.23 |
| Net Debt / EBITDA (Latest) ⓘ | 4.25 | 4.31 |
| Net Debt / Assets ⓘ | 55.07% | 38.42% |
| EBITDA / Interest ⓘ | 4.39 | 4.58 |
| Operating Margin (Latest) ⓘ | 18.33% | 20.83% |
| Operating Margin (5Y Median) ⓘ | 19.50% | 20.08% |
| Debt to Equity (Latest) ⓘ | 283.42% | 137.69% |
| Profit Margin (Latest) ⓘ | 9.02% | 11.37% |
| Free Cash Flow (Latest) ⓘ | -$37.75M | |
Momentum (Price trend) | ||
| 3Y Return ⓘ | +43.23% | +52.37% |
| 12M Return (excl. last month) ⓘ | +7.41% | +8.84% |
| 6M Return ⓘ | -7.56% | -3.95% |
| Price vs. 200-Day MA ⓘ | -0.94% | -0.79% |
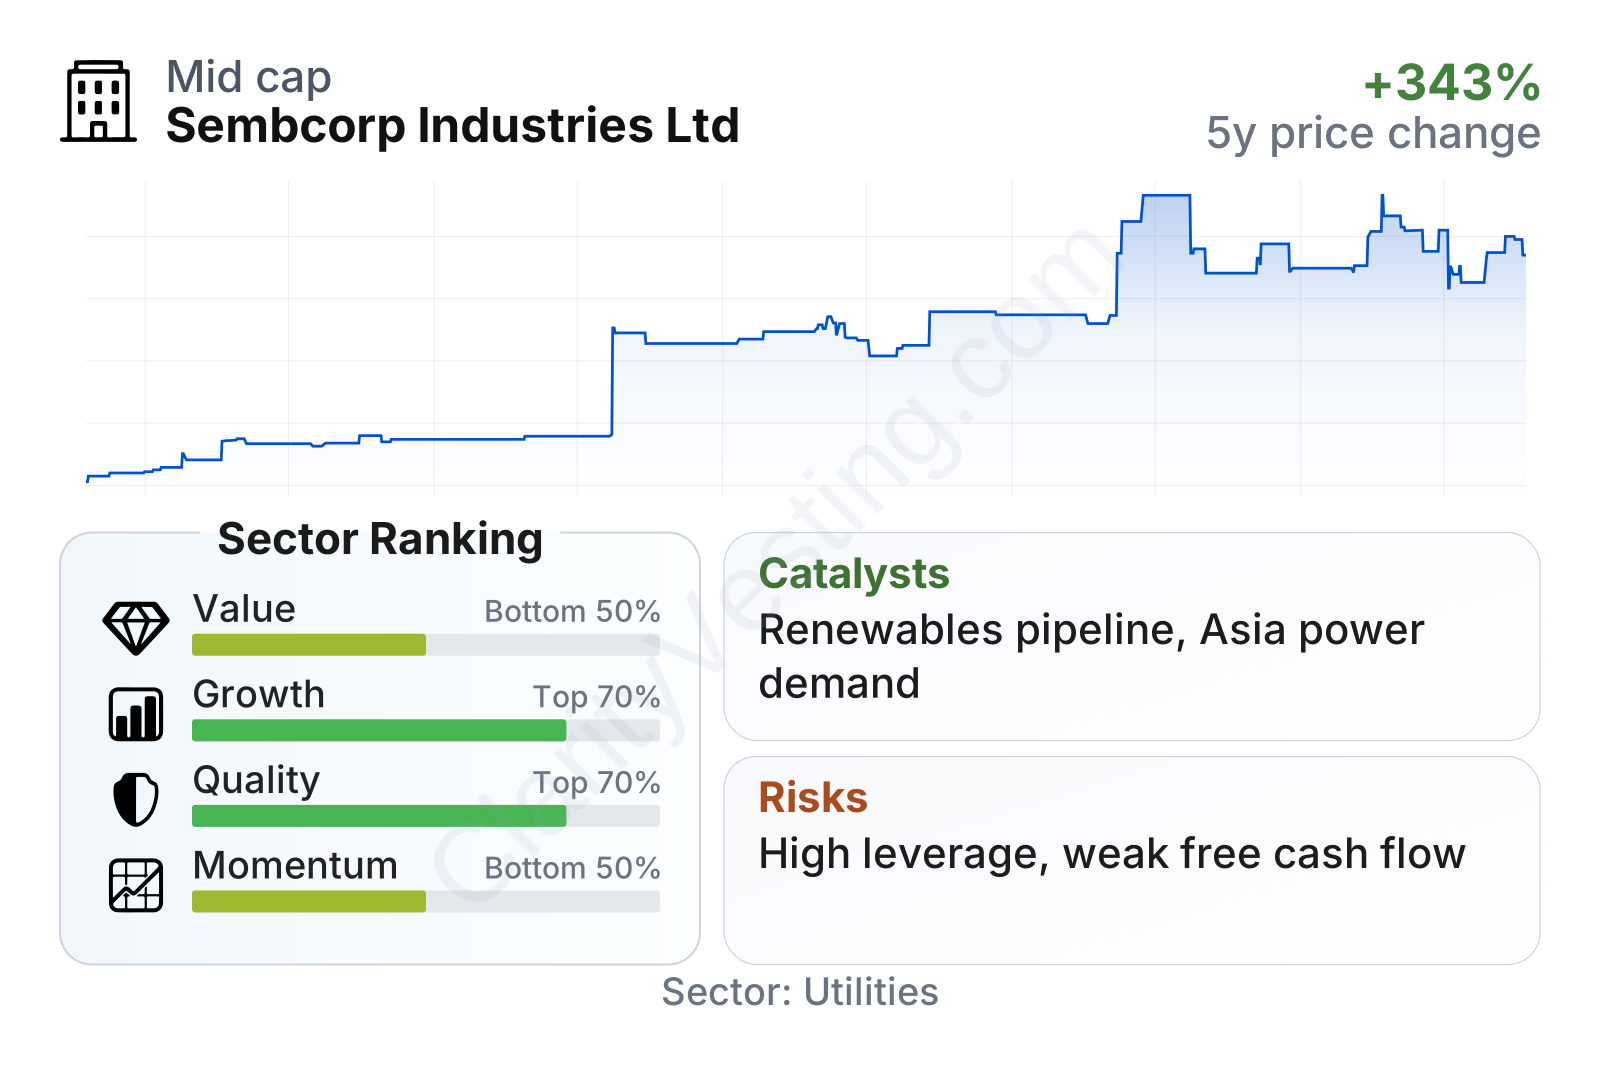
Sembcorp is a large utility company with unusually low share-price volatility for an equity, as reflected in its very low beta. The overall profile is mixed but understandable for a transitioning utility: quality and growth indicators rank above much of the sector, while valuation sits in the weaker half. Recent revenue growth has been strong versus utilities peers, returns on capital are solid, and book value and earnings have compounded well over five years. On the other hand, free cash flow is currently negative, leverage is elevated, and the valuation multiples are somewhat above sector medians.
Growth
Sembcorp operates in a sector with long-duration demand drivers. Electricity demand in Asia continues to rise, while governments and industrial customers are pushing for cleaner generation, grid support, and more resilient utility systems. That creates room for companies that can combine renewable development, dispatchable power, and customer-facing infrastructure. Sembcorp fits that profile better today than it did a few years ago.
The group’s strategy also makes sense in practical terms. It is not trying to become a pure renewable developer overnight. Instead, it is combining renewables with gas, storage, and integrated customer solutions. That matters because power systems still need reliability as they add more intermittent solar and wind. A company that can offer both cleaner generation and system stability can be relevant for a long time.
Management has continued to emphasize renewables expansion, selective capital recycling, and disciplined growth in high-demand markets such as India and Southeast Asia. That is a reasonable direction because these markets need both new generation capacity and supporting infrastructure. Sembcorp’s operating base in Singapore also gives it a strong platform in one of Asia’s most sophisticated power and utilities markets.
Revenue per share has not shown a clean upward trend over the last five years, which is a reminder that this is not a simple high-growth company. The more encouraging point is that earnings and operating performance have improved despite that softer top-line trend, suggesting the company has been improving business mix and margins rather than relying only on sales expansion.
Cash generation deserves close attention. Utilities often go through periods of weaker free cash flow when they are investing heavily in new projects. For Sembcorp, that can be consistent with its transition toward a larger renewables platform, but it still means long-term growth must eventually translate into steadier cash inflows after capital spending.
A meaningful catalyst is the company’s renewable pipeline and its ability to convert development projects into operating assets under contract. Another important growth driver is the broader electrification and decarbonization push among industrial customers, which can support demand for integrated energy, cooling, steam, water, and waste solutions. Recent corporate updates have also highlighted continued additions to renewable capacity and a focus on expanding low-carbon solutions, reinforcing that the strategic shift is ongoing rather than cosmetic.
Risks
This article is for informational purposes only and does not constitute financial advice. Some content is AI-generated. See Disclaimer


