Stock Analysis · Charles Schwab Corp (SCHW)
Overview
The Charles Schwab Corporation is one of the largest U.S. financial services platforms focused on investing, trading, wealth management, and banking. Its core role is to gather client assets and serve individual investors, registered investment advisors, workplace retirement plans, and institutions through a broad platform that combines brokerage accounts, advisory services, custody, asset management, and bank products.
In simple terms, Schwab makes money by bringing in client cash and investment assets, offering places to trade and invest, and earning fees or net interest from those relationships. The company became even larger and more important in the U.S. brokerage industry after integrating TD Ameritrade, which expanded its customer base, advisor custody business, and trading activity.
Based on the company’s recent annual reporting, Schwab’s revenue mix is led by net interest income, with the remainder coming from asset management and administration fees, trading revenue, bank deposit account fees, and other service-related sources. The exact mix changes with interest rates, client cash levels, and market activity, but the broad order is clear.
- Net interest revenue: about 50% to 60% of total revenue in recent periods. This includes earnings on bank loans, securities, margin lending, and invested client cash, minus interest paid on funding sources.
- Asset management and administration fees: about 20% to 25%. This includes advisory fees, mutual fund and ETF-related fees, and administration fees tied to client assets.
- Trading revenue: about 10% to 15%. This mainly comes from order flow-related economics, options, futures, and other trading activity rather than traditional stock commissions.
- Bank deposit account fees and other revenue: about 10% to 15%. This includes service fees, trust and custody-related items, and banking-related account income.
Over the last few years, the business has shown a pattern that is common for brokerage-banks: revenue can continue to grow even when profit temporarily comes under pressure, because funding costs and cash sorting can squeeze margins. That happened in 2023, when revenue held up but earnings fell, before profitability recovered strongly afterward.
The long-term direction has been favorable: total revenue expanded from roughly $19 billion in 2021 to nearly $28 billion in 2025, while net income recovered to a level well above the 2023 dip. Another important point is that operating expenses have risen much more slowly than revenue over that period, which suggests that scale remains a major advantage when business conditions normalize.
Key Figures
| Metric | Value | Sector ⓘ |
|---|---|---|
| Date | Oct 19, 2026 | |
| Context | ||
| Sector | Financial Services | |
| Industry | Capital Markets | |
| Market Cap ⓘ | $159.03B | |
| Beta ⓘ | 0.78 | |
Value (Cheapness) | ||
| P/E Ratio ⓘ | 15.72 | 12.26 |
| P/B Ratio ⓘ | 51.39 | 1.23 |
| FCF Yield ⓘ | 2.33% | 10.40% |
| Dividend Yield ⓘ | 1.31% | 3.02% |
| EBIT / EV ⓘ | 10.59% | 8.14% |
| PEG ⓘ | 0.84 | |
Growth (Business expansion) | ||
| Revenue Growth ⓘ | 16.90% | 9.25% |
| RPS Growth (5Y CAGR) ⓘ | 11.67% | 12.19% |
| EPS Growth (5Y CAGR) ⓘ | 5.27% | -9.36% |
| BVPS Growth (5Y CAGR) ⓘ | 3.32% | 4.99% |
| Margin Growth (5Y Trend) ⓘ | 0.80% | -3.86% |
| FCF Growth (5Y CAGR) ⓘ | 64.32% | 4.81% |
| DPS Growth (5Y CAGR) ⓘ | 8.08% | 8.79% |
Quality (Business durability) | ||
| ROIC (Latest) ⓘ | 13.44% | 9.49% |
| ROE (Latest) ⓘ | 40.53% | 13.87% |
| ROA (Latest) ⓘ | 4.30% | 1.54% |
| ROIC (5Y Median) ⓘ | 8.88% | 7.86% |
| ROE (5Y Median) ⓘ | 14.93% | 12.17% |
| ROA (5Y Median) ⓘ | 1.18% | 1.30% |
| Net Debt / EBIT (Latest) ⓘ | 0.01 | 0.99 |
| Net Debt / EBIT (5Y Median) ⓘ | -0.25 | 0.73 |
| Net Debt / EBITDA (Latest) ⓘ | 0.01 | 0.91 |
| Operating Margin (Latest) ⓘ | 44.34% | 22.30% |
| Operating Margin (5Y Median) ⓘ | 40.60% | 24.63% |
| Debt to Equity (Latest) ⓘ | 13.54% | 58.04% |
| Profit Margin (Latest) ⓘ | 39.33% | 26.57% |
| Free Cash Flow (Latest) ⓘ | $3.71B | |
Momentum (Price trend) | ||
| 3Y Return ⓘ | +78.50% | +88.26% |
| 12M Return (excl. last month) ⓘ | +17.00% | +19.24% |
| 6M Return ⓘ | -0.07% | +4.70% |
| Price vs. 200-Day MA ⓘ | -5.90% | +3.66% |
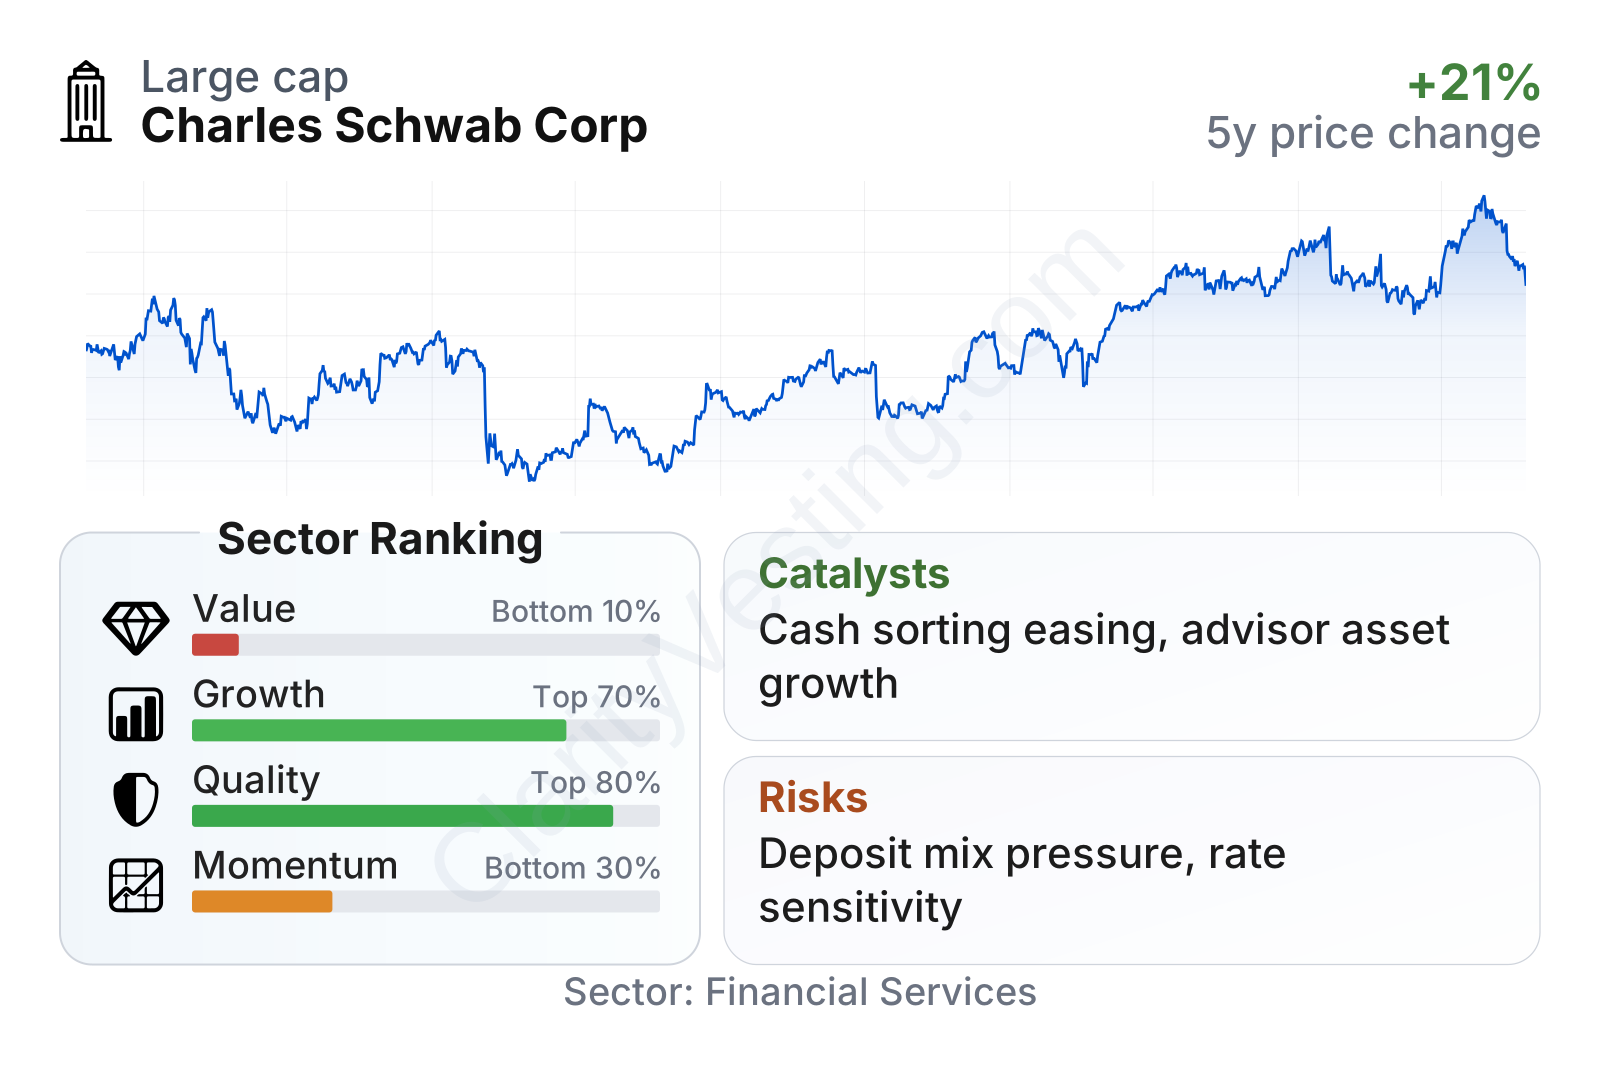
Schwab stands out as a very large, lower-volatility company within financial services, with a beta below 1. On profitability and operating efficiency, it ranks well above many peers, helped by strong margins, high returns on capital, and very modest net debt relative to earnings. Growth metrics are generally solid rather than exceptional, with revenue growth ahead of the sector median and a positive long-term earnings trend despite the 2023 disruption. The weaker area is valuation: the shares trade above the sector median on earnings and far above it on book value, while income yield measures are not especially generous. Recent market performance has also been less strong than the sector, showing that the stock’s rerating has not been uninterrupted.
Growth
Schwab operates in a sector with favorable long-term support: more households are managing their own investments, retirement assets continue to rise over time, fee-based advice keeps gaining share, and independent advisors increasingly need large custody and service platforms. These trends create a steady flow of assets toward scaled firms that can combine low-cost investing, banking convenience, and advisor infrastructure.
Schwab’s strategy fits that environment well. It is not relying on a single product cycle or a narrow niche. Instead, it is building around a broad client ecosystem: retail brokerage, advisory solutions, retirement accounts, banking products, and custody for independent advisors. That mix matters because it can produce growth from several directions at once: more accounts, higher client assets, larger cash balances, more advisory penetration, and stronger trading or lending activity when markets are active.
The biggest operating catalyst has been the normalization after the 2023 cash-sorting pressure. When clients moved cash into higher-yield alternatives, Schwab had to rely more on higher-cost funding, which hurt profitability. As balance sheet funding pressure eased, earnings power improved sharply. That helps explain why the recent earnings path looks much stronger than the temporary slump suggested.
The earnings trend shows a business that absorbed a difficult period and then rebounded strongly. EPS rose from the low-$3 range earlier in the cycle to nearly $5 in 2025, which points to meaningful operating leverage when net interest conditions improve. That rebound is especially important for a company of Schwab’s size, because large mature financial firms usually depend on steady compounding rather than sudden jumps in profitability.
Book value per share also recovered after the sharp drop seen in 2022, then continued to move higher. That matters because it suggests the balance sheet shock was not structural. For a financial company, rebuilding book value supports the view that the business came through a rate-driven stress period with its franchise intact.
Recent company updates have also highlighted continued client asset gathering, advisor platform strength, and ongoing integration benefits from TD Ameritrade. Those factors create room for more scale efficiency over time. Another potential growth support is interest-rate normalization: Schwab does not need dramatically higher rates to benefit, but it does benefit from a healthier funding mix and steadier client cash behavior.
Risks
This article is for informational purposes only and does not constitute financial advice. Some content is AI-generated. See Disclaimer


