Stock Analysis · Standard Chartered PLC (SCBFF)
Overview
Standard Chartered PLC is an international banking group focused mainly on Asia, Africa, and the Middle East. Unlike many large Western banks that are heavily tied to the U.S. or Europe, Standard Chartered earns much of its business from cross-border trade, corporate banking, wealth management, and transaction services in faster-growing emerging markets. Its franchise is especially relevant for multinational companies, financial institutions, affluent clients, and businesses involved in trade corridors linking Asia, the Gulf, and Africa.
The bank reports through a mix of client segments and product lines. Based on its recent annual reporting, revenue is broadly driven by the following activities:
- Transaction Services and Global Markets: approximately 35% to 40% of income. This includes cash management, trade finance, foreign exchange, rates, and financing services used by companies and institutions moving money across borders.
- Corporate and Investment Banking lending and advisory activities: approximately 25% to 30%. This covers loans to large companies and financial institutions, as well as parts of financing and risk management activity.
- Wealth Management and Retail Banking: approximately 20% to 25%. This includes deposits, mortgages, cards, investment products, bancassurance, and advisory services for affluent and mass retail clients.
- Private Banking and other activities: approximately 5% to 10%. This includes services for high-net-worth clients and smaller residual items.
Geographically, the profit engine is centered on Asian markets, with Hong Kong and Singapore particularly important, while the bank also maintains meaningful exposure to India, mainland China, the Gulf, and parts of Africa. That regional mix gives Standard Chartered a different earnings profile from U.S. and European peers: more tied to trade flows, emerging-market growth, and interest-rate conditions in Asia.
Over the past few years, the business has also become more profitable. Revenue and net income have climbed meaningfully from 2021 to 2025, showing that higher activity levels, better rate conditions, and tighter execution have helped operating earnings expand faster than costs.
The revenue base is much larger than it was a few years ago, while net income has risen from roughly the low-$2 billion range in 2021 to above $5 billion in 2025. That points to stronger underlying earning power, even though banking results can still move with credit costs and market conditions.
Key Figures
| Metric | Value | Sector ⓘ |
|---|---|---|
| Date | Oct 17, 2026 | |
| Context | ||
| Sector | Financial Services | |
| Industry | Banks - Diversified | |
| Market Cap ⓘ | $60.99B | |
| Beta ⓘ | 0.56 | |
Value (Cheapness) | ||
| P/E Ratio ⓘ | 13.32 | 12.26 |
| P/B Ratio ⓘ | 1.18 | 1.23 |
| FCF Yield ⓘ | 4.03% | 10.40% |
| Dividend Yield ⓘ | 2.47% | 3.02% |
| EBIT / EV ⓘ | N/A | 8.14% |
| PEG ⓘ | 0.90 | |
Growth (Business expansion) | ||
| Revenue Growth ⓘ | 2.70% | 9.35% |
| RPS Growth (5Y CAGR) ⓘ | 29.63% | 12.19% |
| EPS Growth (5Y CAGR) ⓘ | 12.09% | -9.53% |
| BVPS Growth (5Y CAGR) ⓘ | -0.01% | 4.99% |
| Margin Growth (5Y Trend) ⓘ | -6.46% | -3.86% |
| FCF Growth (5Y CAGR) ⓘ | N/A | 4.81% |
| DPS Growth (5Y CAGR) ⓘ | 26.24% | 8.79% |
Quality (Business durability) | ||
| ROIC (Latest) ⓘ | N/A | 9.49% |
| ROE (Latest) ⓘ | 10.74% | 13.90% |
| ROA (Latest) ⓘ | 0.57% | 1.55% |
| ROIC (5Y Median) ⓘ | 2.46% | 7.86% |
| ROE (5Y Median) ⓘ | 7.02% | 12.17% |
| ROA (5Y Median) ⓘ | 0.42% | 1.30% |
| Net Debt / EBIT (Latest) ⓘ | N/A | 0.96 |
| Net Debt / EBIT (5Y Median) ⓘ | 5.78 | 0.73 |
| Net Debt / EBITDA (Latest) ⓘ | 3.56 | 0.92 |
| Operating Margin (Latest) ⓘ | N/A | 22.30% |
| Operating Margin (5Y Median) ⓘ | 23.67% | 24.63% |
| Debt to Equity (Latest) ⓘ | 203.88% | 58.56% |
| Profit Margin (Latest) ⓘ | 26.03% | 26.57% |
| Free Cash Flow (Latest) ⓘ | $2.46B | |
Momentum (Price trend) | ||
| 3Y Return ⓘ | +232.90% | +88.33% |
| 12M Return (excl. last month) ⓘ | +61.93% | +19.38% |
| 6M Return ⓘ | +16.53% | +4.75% |
| Price vs. 200-Day MA ⓘ | +9.18% | +3.50% |
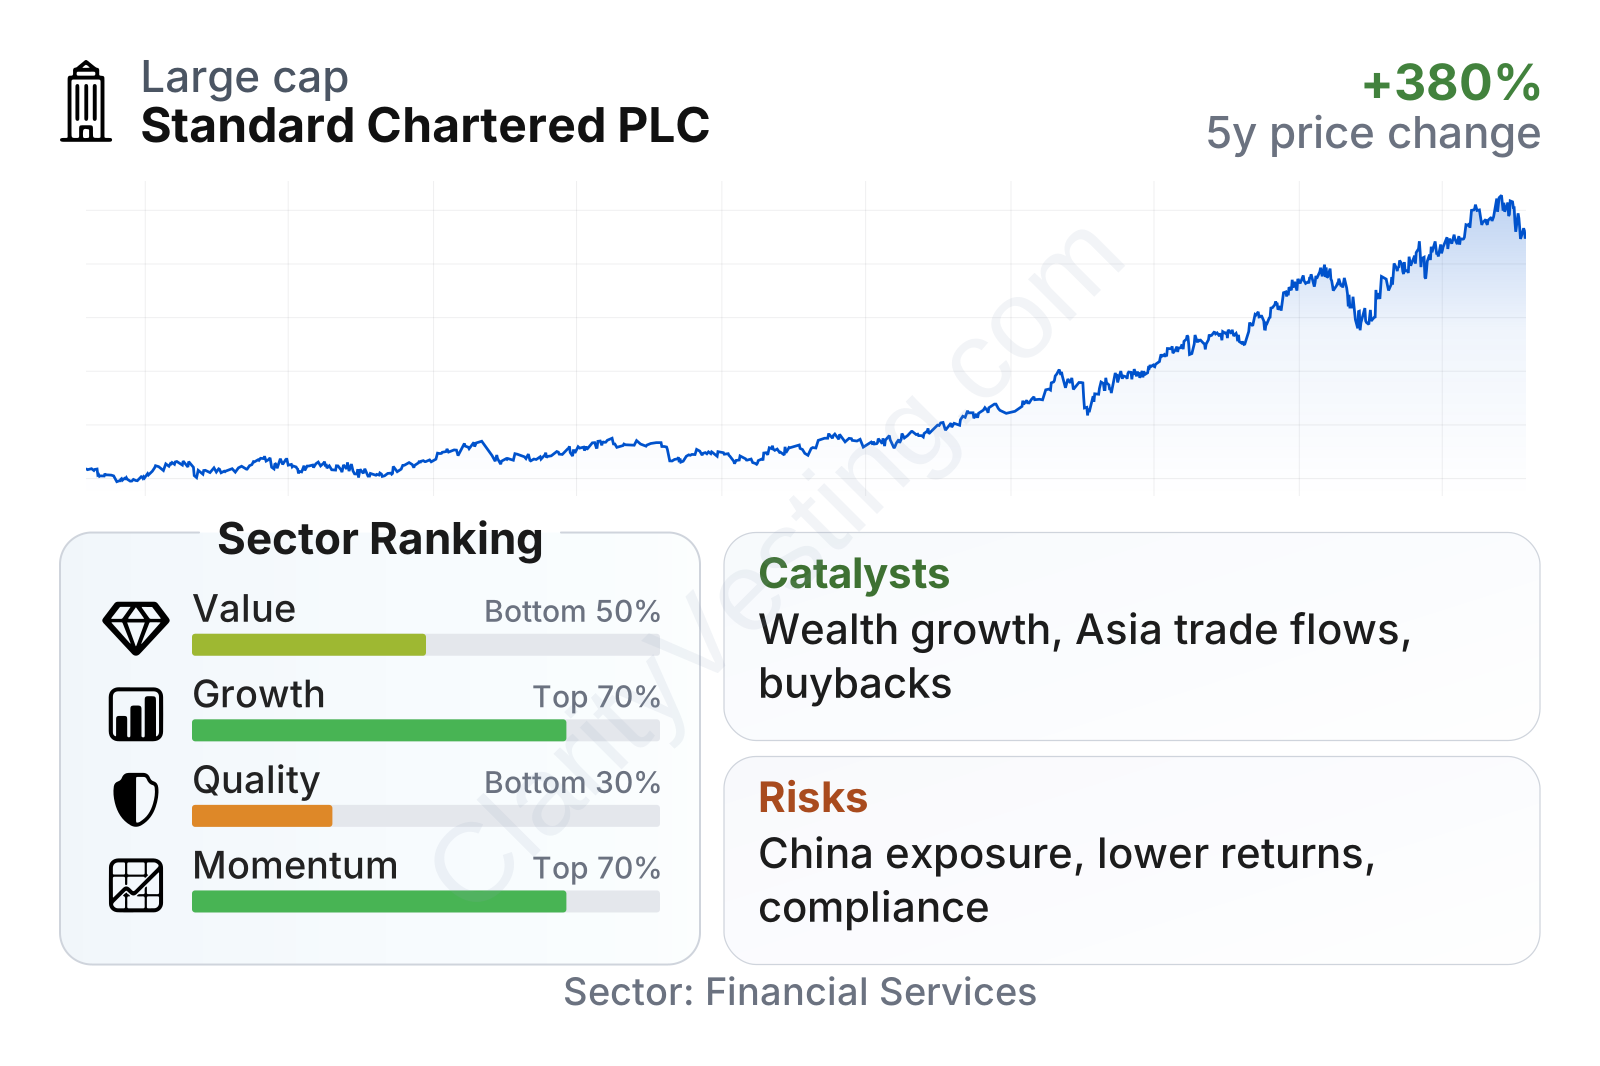
Standard Chartered is a large global bank with a market value around the low-$60 billion range and a relatively low share-price volatility profile, as reflected by a beta well below 1. The stock’s recent market performance has been strong, with returns over the last one-, three-, and multi-year periods clearly ahead of the sector median. On growth, the picture is favorable: long-term revenue per share and earnings per share trends are stronger than much of the banking sector, even if the most recent year-over-year revenue growth rate is more moderate.
On valuation, the stock sits near the sector on earnings and somewhat below the sector on book value, which suggests the market is no longer treating it as a deeply discounted bank but also is not assigning a major premium. Quality remains the weaker area. Profitability ratios such as return on equity and return on assets have improved, yet they still trail many diversified banking peers, which helps explain why the market continues to value the company with some caution.
Growth
Standard Chartered operates in parts of banking that still have room to expand over the long run. Its footprint is concentrated in regions where wealth creation, trade flows, infrastructure financing, and demand for cross-border payments are structurally growing faster than in many developed markets. This does not make the sector risk-free, but it does mean the bank is linked to several durable themes: rising Asian affluence, corporate internationalization, Middle East capital flows, and the ongoing need for trade and treasury services.
The strategy is reasonably coherent. Management has been emphasizing affluent banking, wealth products, transaction banking, and markets-related businesses where the group already has established client relationships. These areas can be attractive because they often use the same network, balance sheet, and client base across multiple countries. That creates an efficiency advantage that is difficult for purely domestic banks to replicate.
Earnings per share have moved up sharply since 2021, with a particularly strong step-up through 2025. That matters because it suggests the improvement is not only coming from balance-sheet growth, but also from better profitability for each share outstanding. The trend supports the view that recent gains are more than a short-lived rebound.
Book value per share has been more uneven. It improved through 2024, then pulled back in 2025, which is not unusual for a global bank exposed to currency moves, capital returns, and changes in the value of financial assets. Even so, the broader picture is that Standard Chartered has been building earnings power faster than it has been compounding book value, meaning future progress likely depends more on sustained returns than on simple balance-sheet expansion.
A visible catalyst has been capital distribution combined with stronger profitability targets. The bank has recently highlighted shareholder distributions, efficiency actions, and continued focus on affluent clients and transaction banking. Another support is the company’s exposure to wealth centers such as Hong Kong, Singapore, and the Gulf, where client assets and cross-border financial activity have continued to grow. If this mix keeps shifting toward fee income and wealth products, revenue could become more balanced and less reliant on pure lending spreads.
Recent company updates have also pointed to continued momentum in wealth management, cross-border business flows, and a still-important benefit from the group’s geographic positioning between Asian, African, and Middle Eastern markets. For a bank like Standard Chartered, that network effect is one of the clearest long-term opportunities.
Risks
This article is for informational purposes only and does not constitute financial advice. Some content is AI-generated. See Disclaimer


