Stock Analysis · Sibanye Stillwater Limited (SBYSF)
Overview
Sibanye Stillwater Limited is a diversified mining company focused on precious metals and selected battery metals. The group started as a South African gold producer and later expanded into platinum group metals, often called PGMs, such as platinum, palladium, rhodium, and iridium. It also owns recycling operations in the United States and has been building a position in metals tied to the energy transition, including lithium, nickel, and zinc through projects and partnerships.
In practical terms, the company makes money by mining metals from underground and surface operations, processing them, and selling refined or concentrate products into industrial, jewelry, automotive, and investment markets. Its business mix has shifted over time away from being mainly gold-based toward PGMs, which are used heavily in vehicle emissions systems and several industrial applications.
The main revenue sources are broadly the following, ranked from largest to smallest based on the company’s recent operating structure and reported segment mix:
- South African PGM operations: approximately 45% to 55% of group revenue in recent years. This includes mined and processed platinum, palladium, rhodium, ruthenium, iridium, chrome by-products, and nickel from operations such as Rustenburg, Marikana, and Kroondal.
- U.S. PGM operations: approximately 20% to 30%. This is centered on the Stillwater and East Boulder mines in Montana, producing mainly palladium and platinum.
- Gold operations in South Africa: approximately 15% to 25%. This includes underground and surface gold production, as well as retreatment activities.
- Recycling operations: approximately 5% to 15%. This business processes spent catalytic converters and other recyclable material to recover PGMs.
- Battery metals and other projects: currently a small share of revenue. These assets are more important as future options than as major contributors today.
This mix matters for long-term analysis because Sibanye Stillwater is no longer just a gold miner. It is now much more exposed to the PGM market, which creates both diversification and greater sensitivity to auto demand, industrial cycles, and metal price swings.
The company’s earnings profile has been highly cyclical. Revenue stayed broadly above its pre-expansion scale, but profitability narrowed sharply after the exceptional commodity conditions of 2021 and 2022. More recently, operating income recovered compared with 2024, helped by cost actions and better operating performance, but bottom-line results have remained under pressure from financing costs, taxes, and a still-challenging pricing environment.
Key Figures
| Metric | Value | Sector ⓘ |
|---|---|---|
| Date | Oct 17, 2026 | |
| Context | ||
| Sector | Basic Materials | |
| Industry | Other Precious Metals & Mining | |
| Market Cap ⓘ | $6.90B | |
| Beta ⓘ | 0.92 | |
Value (Cheapness) | ||
| P/E Ratio ⓘ | 8.00 | 16.90 |
| P/B Ratio ⓘ | 0.16 | 1.65 |
| FCF Yield ⓘ | 223.64% | 5.76% |
| Dividend Yield ⓘ | 8.34% | 2.13% |
| EBIT / EV ⓘ | N/A | 6.30% |
| PEG ⓘ | N/A | |
Growth (Business expansion) | ||
| Revenue Growth ⓘ | 64.30% | 11.10% |
| RPS Growth (5Y CAGR) ⓘ | -6.22% | 4.49% |
| EPS Growth (5Y CAGR) ⓘ | N/A | -13.47% |
| BVPS Growth (5Y CAGR) ⓘ | -18.05% | 5.51% |
| Margin Growth (5Y Trend) ⓘ | -9.33% | -1.54% |
| FCF Growth (5Y CAGR) ⓘ | -44.83% | 0.37% |
| DPS Growth (5Y CAGR) ⓘ | -63.86% | 6.08% |
Quality (Business durability) | ||
| ROIC (Latest) ⓘ | N/A | 9.26% |
| ROA (Latest) ⓘ | 7.63% | 4.91% |
| ROIC (5Y Median) ⓘ | 23.04% | 7.70% |
| ROA (5Y Median) ⓘ | -3.58% | 3.86% |
| Net Debt / EBIT (Latest) ⓘ | 0.42 | 1.40 |
| Net Debt / EBIT (5Y Median) ⓘ | -0.10 | 1.70 |
| Net Debt / EBITDA (Latest) ⓘ | 0.27 | 0.95 |
| Net Debt / Assets ⓘ | 9.35% | 13.69% |
| EBITDA / Interest ⓘ | 10.58 | 12.34 |
| Operating Margin (Latest) ⓘ | 11.68% | 13.20% |
| Operating Margin (5Y Median) ⓘ | 19.32% | 11.80% |
| Debt to Equity (Latest) ⓘ | 69.54% | 40.56% |
| Profit Margin (Latest) ⓘ | 9.80% | 6.43% |
| Free Cash Flow (Latest) ⓘ | $15.43B | |
Momentum (Price trend) | ||
| 3Y Return ⓘ | +80.86% | +68.89% |
| 12M Return (excl. last month) ⓘ | +39.43% | +30.21% |
| 6M Return ⓘ | -20.87% | -4.16% |
| Price vs. 200-Day MA ⓘ | -17.04% | -1.27% |
Sibanye Stillwater screens as inexpensive on traditional valuation measures. Its earnings multiple is well below the sector median, its price-to-book ratio is extremely low, and its dividend yield is much higher than the industry midpoint. Balance sheet leverage is not stretched by sector standards on net debt to EBITDA and net debt to EBIT, while profitability remains respectable on trailing margins and return on assets. The weaker area is long-term growth quality: recent revenue improved sharply year over year, but the five-year record for revenue per share, book value per share, free cash flow, and dividends has been unfavorable. In short, the market is recognizing a rebound, but it is still pricing in significant caution about durability.
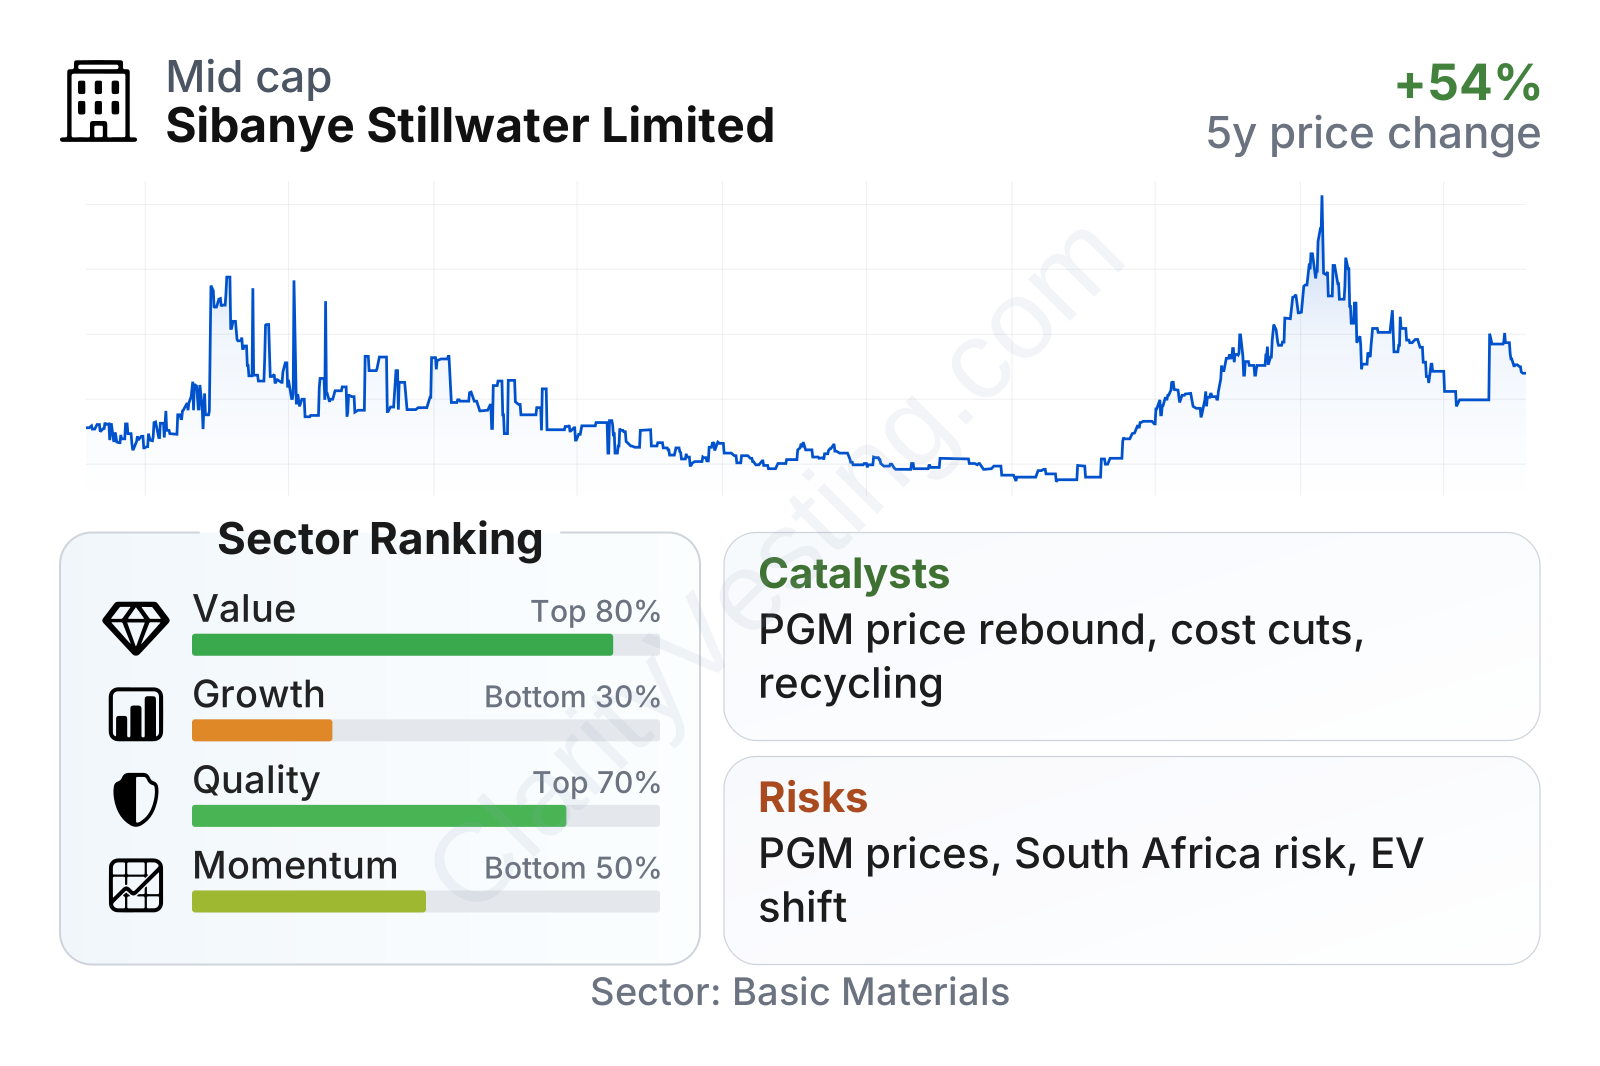
The stock chart also reflects that volatility. Shares climbed strongly into early 2026 after a long weak period, then gave back a meaningful part of that move by mid-2026. That pattern fits a commodity producer whose valuation can change quickly with metal prices, operating updates, and sentiment around South African mining risk.
Growth
Sibanye Stillwater operates in sectors that have mixed long-term demand drivers. Gold remains supported by its role as a store of value and reserve asset. PGMs face a more complicated path: platinum has support from industrial demand, jewelry, and potential substitution for more expensive palladium in some uses, while palladium demand is more dependent on internal combustion vehicle production. Over the longer term, stricter emissions standards can support PGM loadings, but the shift toward battery electric vehicles can reduce demand for catalytic-converter metals in some markets.
The company’s strategy for future growth is logical, but not simple. Management has been reshaping the portfolio, cutting costs in pressured operations, preserving liquidity, and trying to build optionality in battery metals and recycling. That approach makes strategic sense because it reduces reliance on a single metal and gives the company exposure to both traditional precious metals and energy-transition materials. The challenge is that several of these newer projects require time, capital, and favorable market conditions before they can become meaningful earnings contributors.
The strongest near-term catalysts are tied less to volume expansion and more to recovery. If PGM prices improve from depressed levels, the earnings effect can be significant because the company already has large operating capacity in place. Platinum market tightening, better performance at U.S. operations, and benefits from restructuring in South Africa could all improve margins faster than revenue alone would suggest. A second catalyst is operational discipline: after a period of impairments and weak profitability, even moderate stabilization can have an outsized effect on reported results.
Recent company updates have also pointed to portfolio simplification and project prioritization rather than aggressive expansion for its own sake. For long-term observers, that is important. The company appears more focused on returns and survivability through the cycle than on chasing production growth at any cost.
Risks
This article is for informational purposes only and does not constitute financial advice. Some content is AI-generated. See Disclaimer


