Stock Analysis · Southern BancShares N.C. Inc (SBNC)
Overview
Southern BancShares N.C. Inc is the holding company for Southern Bank and Trust Company, a regional bank based in North Carolina. It focuses on traditional community banking: taking deposits, making loans, providing mortgage banking services, and offering wealth management and related financial services to individuals, small businesses, and commercial customers. Its footprint is concentrated in North Carolina and Virginia, which makes the company more locally focused than the largest national banks.
Like most regional banks, its business model is built mainly on earning a spread between what it pays depositors and what it earns on loans and securities, then adding fee income from other banking services. Based on recent annual reporting, the main revenue sources can be summarized as follows:
- Net interest income: approximately 75% to 85% of total revenue. This is the core banking engine and includes interest collected on commercial real estate loans, residential mortgages, consumer lending, and investment securities, minus interest paid on deposits and borrowings.
- Mortgage banking and loan-related fees: approximately 5% to 15%. This generally includes gains on mortgage originations and sales, servicing-related income, and loan fee activity.
- Service charges, card, and deposit account fees: approximately 3% to 8%. This covers customer transaction fees and account-related charges.
- Wealth management, trust, insurance, and other noninterest income: approximately 3% to 8%. This includes advisory, fiduciary, and other customer service income streams outside basic lending.
That mix matters because it shows SBNC is still primarily a spread-based bank rather than a diversified fee platform. When interest margins are favorable, earnings can rise quickly. When deposit costs climb or credit conditions weaken, results can swing more than at institutions with larger fee businesses.
The longer-term financial path has also been uneven rather than linear. Revenue and profit expanded strongly through 2024, while 2025 appears materially softer. That pattern suggests the bank has meaningful earnings power, but it is still exposed to the normal volatility of regional banking conditions, including funding costs, loan demand, and credit performance.
The operating picture over the last several years shows how sensitive results are to the banking cycle. Revenue and operating profit improved sharply after the weaker 2022 period, peaked higher in 2024, and then retreated in 2025. Even with that pullback, profit margins remained healthy, which indicates the franchise still generates solid earnings when conditions are supportive.
Key Figures
| Metric | Value | Sector ⓘ |
|---|---|---|
| Date | Oct 17, 2026 | |
| Context | ||
| Sector | Financial Services | |
| Industry | Banks - Regional | |
| Market Cap ⓘ | $1.03B | |
| Beta ⓘ | 0.20 | |
Value (Cheapness) | ||
| P/E Ratio ⓘ | 14.98 | 12.26 |
| P/B Ratio ⓘ | 1.35 | 1.23 |
| FCF Yield ⓘ | N/A | 10.40% |
| Dividend Yield ⓘ | 0.09% | 3.02% |
| EBIT / EV ⓘ | N/A | 8.14% |
| PEG ⓘ | N/A | |
Growth (Business expansion) | ||
| Revenue Growth ⓘ | 37.70% | 9.35% |
| RPS Growth (5Y CAGR) ⓘ | 7.33% | 12.19% |
| EPS Growth (5Y CAGR) ⓘ | 29.54% | -9.53% |
| BVPS Growth (5Y CAGR) ⓘ | 13.24% | 4.99% |
| Margin Growth (5Y Trend) ⓘ | -22.06% | -3.86% |
| FCF Growth (5Y CAGR) ⓘ | 512.63% | 4.81% |
| DPS Growth (5Y CAGR) ⓘ | 490.36% | 8.79% |
Quality (Business durability) | ||
| ROIC (Latest) ⓘ | N/A | 9.49% |
| ROE (Latest) ⓘ | 9.22% | 13.90% |
| ROA (Latest) ⓘ | 1.15% | 1.55% |
| ROIC (5Y Median) ⓘ | N/A | 7.86% |
| ROE (5Y Median) ⓘ | 21.69% | 12.17% |
| ROA (5Y Median) ⓘ | 2.22% | 1.30% |
| Net Debt / EBIT (Latest) ⓘ | N/A | 0.96 |
| Net Debt / EBIT (5Y Median) ⓘ | -0.88 | 0.73 |
| Net Debt / EBITDA (Latest) ⓘ | -3.40 | 0.92 |
| Operating Margin (Latest) ⓘ | N/A | 22.30% |
| Operating Margin (5Y Median) ⓘ | 53.12% | 24.63% |
| Debt to Equity (Latest) ⓘ | 2.34% | 58.56% |
| Profit Margin (Latest) ⓘ | 39.89% | 26.57% |
| Free Cash Flow (Latest) ⓘ | N/A | |
Momentum (Price trend) | ||
| 3Y Return ⓘ | +161.62% | +88.33% |
| 12M Return (excl. last month) ⓘ | +41.61% | +19.38% |
| 6M Return ⓘ | +17.00% | +4.75% |
| Price vs. 200-Day MA ⓘ | +25.58% | +3.50% |
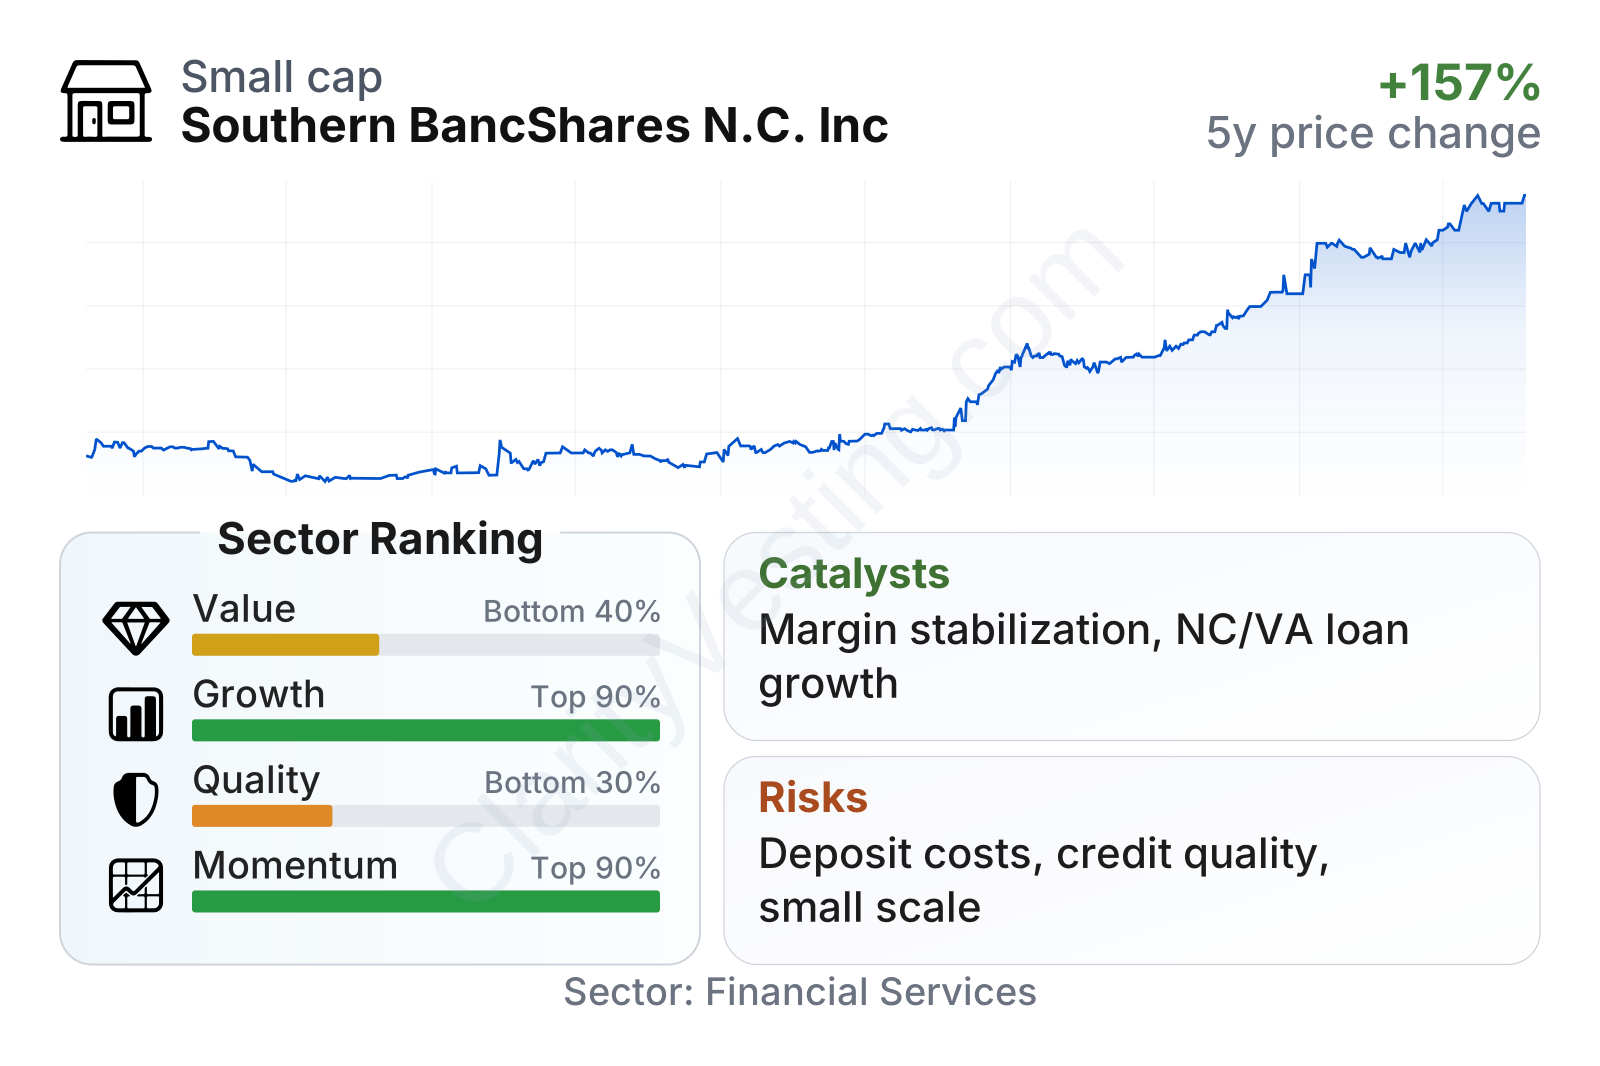
SBNC is a relatively small public bank, with a market value around $1 billion, and its share price volatility has been very low, reflected in a beta far below the broader market. The stock’s recent market performance has been strong compared with much of the regional banking group, and momentum ranks well within the sector. Growth indicators also stand out, especially recent revenue growth and multi-year expansion in earnings per share and book value per share. The weaker area is quality in current profitability terms: return on equity and return on assets are below sector medians, even though profit margin remains strong and balance-sheet leverage appears conservative. On valuation, the shares do not look obviously cheap relative to regional bank peers, with both earnings and book multiples modestly above the sector median and a very small dividend yield.
Growth
SBNC operates in regional banking, a sector that is mature rather than fast-growing, but still capable of producing attractive long-term expansion through market share gains, disciplined underwriting, acquisitions, and deposit gathering in growing local economies. North Carolina and parts of the Southeast remain favorable banking markets because of population growth, business formation, and housing activity. That backdrop gives community and regional banks room to expand even without being in a high-growth industry in the usual technology sense.
The company’s strategy is sensible for that setting. It remains centered on local relationship banking, which can support durable deposit franchises and repeat lending business from small and mid-sized commercial clients. For a bank of this size, execution matters more than scale alone: maintaining low-cost deposits, controlling credit losses, and building selective fee income can steadily compound book value over time.
The earnings profile over the past several years has been impressive on a multi-year basis, despite visible year-to-year swings. Five-year earnings-per-share growth ranks near the top of the sector, which suggests the franchise has created value over time even if annual results are cyclical. The key question is not whether the bank can produce earnings, but how durable that level is after the very strong 2023-2024 period and the softer 2025 outcome.
Book value growth is another important marker for banks, and SBNC’s five-year trend compares favorably with peers. That is a constructive signal because book value often reflects the cumulative effect of retained earnings, credit quality, and capital management. The chart series appears distorted in the most recent plotted values, so the more reliable takeaway is the broader multi-year growth rate rather than the exact points shown.
A meaningful catalyst is the possibility of margin stabilization if funding costs stop rising while loan yields remain firm. Another is continued expansion in its commercial and consumer banking markets across North Carolina and Virginia. If management can preserve credit quality while deepening customer relationships, revenue growth can continue without requiring aggressive balance-sheet risk. Public company updates in 2026 also remain important because any sign of stronger deposit trends, better loan growth, or steadier credit costs would support the case that the weaker 2025 period was not a structural decline.
Risks
This article is for informational purposes only and does not constitute financial advice. Some content is AI-generated. See Disclaimer


