Stock Analysis · Star Bulk Carriers Corp (SBLK)
Overview
Star Bulk Carriers Corp is a dry bulk shipping company. In simple terms, it owns and operates vessels that transport large volumes of raw materials used across the global economy. These cargoes include iron ore for steelmaking, coal, grain, bauxite, fertilizers, and other bulk commodities. The company operates one of the largest listed dry bulk fleets, with vessels spread across the main size categories used in the industry, from smaller ships serving regional routes to very large Capesize vessels used on long-haul commodity routes.
The business is fairly straightforward: Star Bulk earns money by chartering its ships to customers that need to move commodities between exporting and importing countries. Revenue depends mainly on how many ships are working, what day rates the company can secure, and how efficiently it controls vessel operating costs, fuel use, financing costs, and downtime.
Based on company filings, Star Bulk’s revenue is overwhelmingly generated by voyage and time charter services in dry bulk transportation. The reporting structure does not usually break revenue into many separate business lines, because the company is essentially focused on one core activity. A practical way to think about revenue is the cargo mix and charter exposure behind that shipping income.
- Dry bulk vessel charter revenue: about 95% to 100% of total revenue. This includes transportation of major bulks such as iron ore, coal, and grain, as well as minor bulks like bauxite, steel products, and fertilizers.
- Ancillary and other shipping-related income: about 0% to 5%. This may include small items tied to the operation of the fleet, but it is not a major profit driver.
Another useful breakdown is by vessel type rather than accounting line item. Star Bulk has meaningful exposure to Capesize, Newcastlemax, Kamsarmax, Panamax, Ultramax, and Supramax ships. Larger vessels tend to be tied more closely to iron ore and coal trades, while mid-sized and smaller ships often serve a more diversified mix of agricultural products and minor bulks. That fleet diversification matters because it reduces dependence on a single route or commodity.
The profit flow over the last several years shows the classic shape of a cyclical shipping company: very strong earnings during favorable freight markets, then a sharp compression when rates weaken, followed by recovery. Revenue rebounded in 2024 after a soft 2023, but profit remained well below the 2021–2022 peak cycle, showing how sensitive results are to freight conditions rather than to simple fleet growth alone.
Key Figures
| Metric | Value | Sector ⓘ |
|---|---|---|
| Date | Oct 17, 2026 | |
| Context | ||
| Sector | Industrials | |
| Industry | Marine Shipping | |
| Market Cap ⓘ | $3.46B | |
| Beta ⓘ | 0.76 | |
Value (Cheapness) | ||
| P/E Ratio ⓘ | 11.68 | 22.10 |
| P/B Ratio ⓘ | 1.28 | 1.97 |
| FCF Yield ⓘ | 8.27% | 6.38% |
| Dividend Yield ⓘ | 6.30% | 1.94% |
| EBIT / EV ⓘ | 8.24% | 4.79% |
| PEG ⓘ | 1.95 | |
Growth (Business expansion) | ||
| Revenue Growth ⓘ | 44.50% | 9.30% |
| RPS Growth (5Y CAGR) ⓘ | -10.48% | 7.81% |
| EPS Growth (5Y CAGR) ⓘ | -28.08% | -13.06% |
| BVPS Growth (5Y CAGR) ⓘ | 0.87% | 6.14% |
| Margin Growth (5Y Trend) ⓘ | -36.57% | 0.88% |
| FCF Growth (5Y CAGR) ⓘ | -24.05% | 11.01% |
| DPS Growth (5Y CAGR) ⓘ | -39.81% | 9.48% |
Quality (Business durability) | ||
| ROIC (Latest) ⓘ | 9.50% | 10.84% |
| ROA (Latest) ⓘ | 7.51% | 5.41% |
| ROIC (5Y Median) ⓘ | 10.30% | 9.38% |
| ROA (5Y Median) ⓘ | 8.56% | 4.95% |
| Net Debt / EBIT (Latest) ⓘ | 1.78 | 2.08 |
| Net Debt / EBIT (5Y Median) ⓘ | 3.03 | 2.27 |
| Net Debt / EBITDA (Latest) ⓘ | 1.21 | 1.39 |
| Net Debt / Assets ⓘ | 15.97% | 19.28% |
| EBITDA / Interest ⓘ | 8.71 | 9.58 |
| Operating Margin (Latest) ⓘ | 28.81% | 10.50% |
| Operating Margin (5Y Median) ⓘ | 26.93% | 10.29% |
| Debt to Equity (Latest) ⓘ | 46.89% | 65.48% |
| Profit Margin (Latest) ⓘ | 23.87% | 6.67% |
| Free Cash Flow (Latest) ⓘ | $286.08M | |
Momentum (Price trend) | ||
| 3Y Return ⓘ | +79.66% | +61.68% |
| 12M Return (excl. last month) ⓘ | +72.15% | +12.58% |
| 6M Return ⓘ | +22.92% | 0.00% |
| Price vs. 200-Day MA ⓘ | +14.66% | +0.02% |
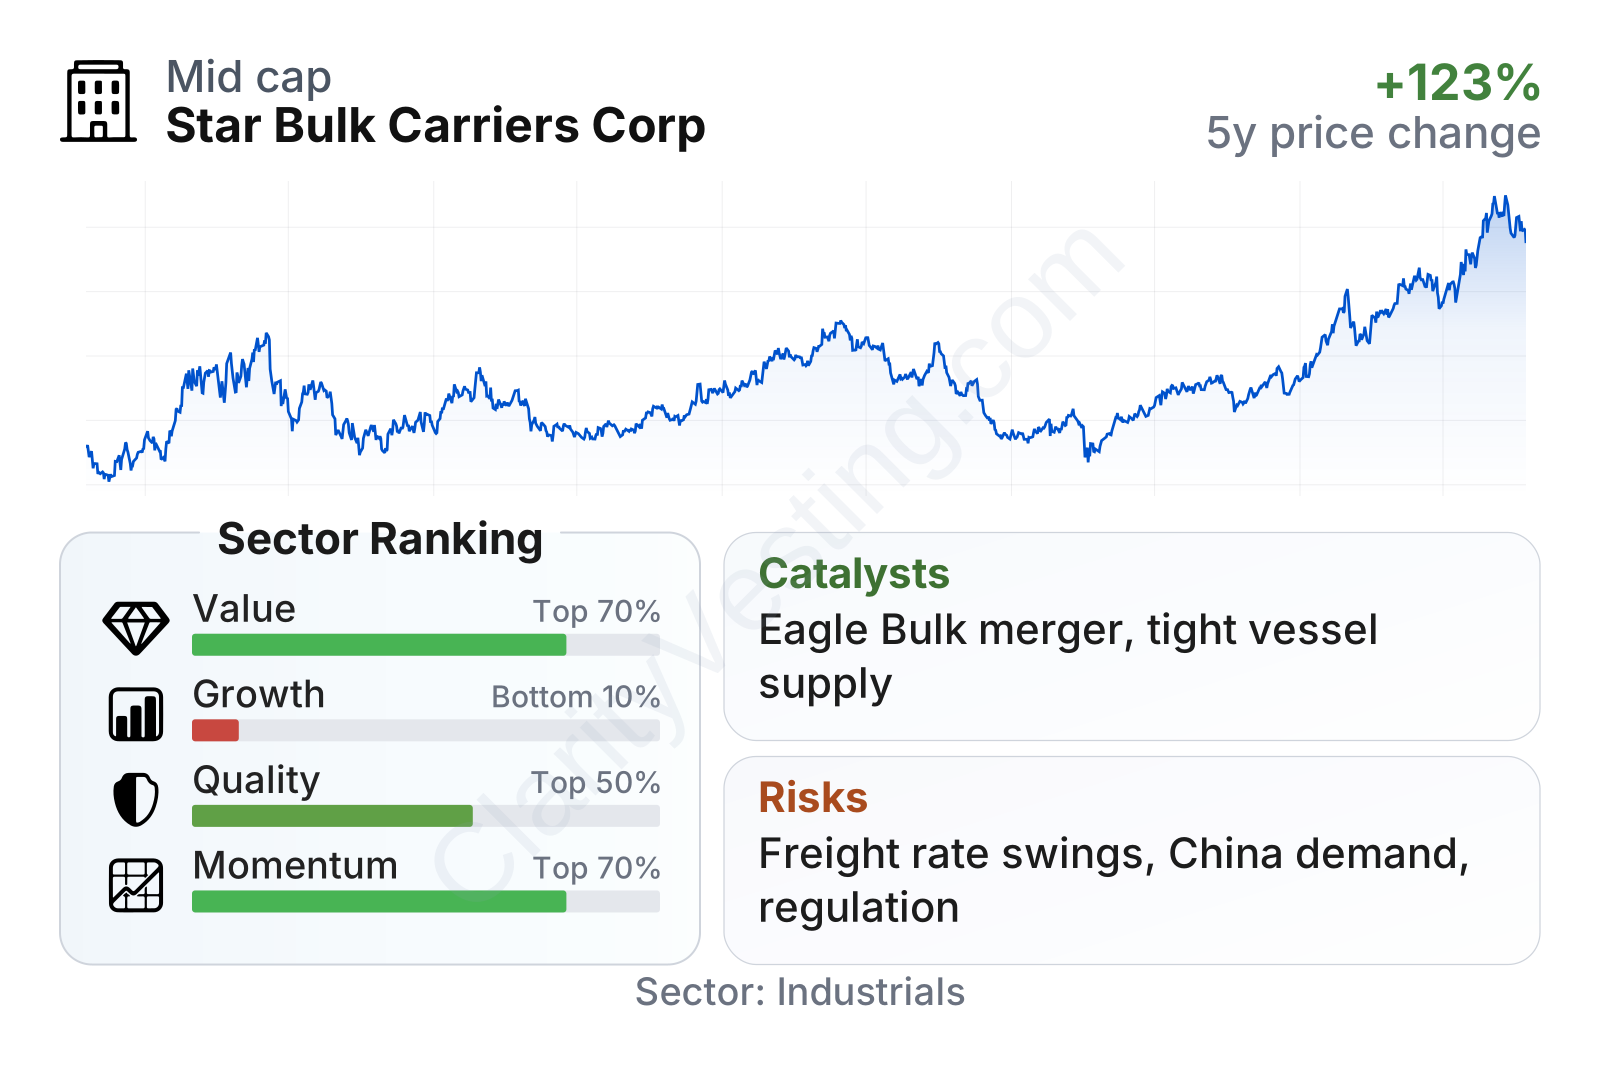
Star Bulk sits in the mid-cap range and has shown strong recent share-price momentum, but the operating picture is more mixed beneath the surface. On valuation measures, the company screens cheaper than the broader sector, with a lower earnings multiple and book multiple, while free cash flow yield and dividend yield are notably above sector medians. On quality, profitability is strong for the current period, with operating margin close to 29% and profit margin near 24%, both well above typical sector levels. Balance sheet leverage also looks manageable, with debt to equity around 47%, below the sector median.
The weaker area is long-term growth consistency. Recent year-over-year revenue growth has recovered sharply, but the five-year trend in revenue per share, earnings, free cash flow, and dividend growth remains poor because shipping results moved down substantially after the 2021–2022 freight boom. This combination is common in cyclical transport businesses: strong current recovery metrics can coexist with weak multi-year compounded growth.
Growth
Dry bulk shipping is not a traditional high-growth sector in the way software or semiconductors can be. It is better described as an essential and cyclical infrastructure business. Demand comes from global industrial activity, steel production, electricity generation in some regions, grain trade, and commodity movements tied to construction and manufacturing. Over the long term, seaborne trade in bulk commodities tends to grow with population, urbanization, and emerging-market development, but yearly results can swing sharply with economic conditions and vessel supply.
Star Bulk’s strategy makes sense for this kind of industry. Instead of trying to transform itself into a different business, it focuses on scale, fleet diversity, commercial optimization, and cost efficiency. A large fleet can create advantages in procurement, technical management, port coverage, and customer service. The company has also emphasized fuel-saving upgrades and fleet management discipline, which matter more as environmental rules tighten and fuel efficiency becomes a bigger differentiator.
Recent revenue momentum has improved again after the 2023 downturn. The latest year-over-year growth rate is well ahead of the sector median, suggesting the company is benefiting from a better freight environment and operational recovery. That said, the chart also shows why Star Bulk should be viewed through a cycle-aware lens: growth can move from strongly positive to sharply negative and back again in a short period.
Free cash flow remains positive and sizable, although below the exceptional levels seen earlier in the cycle. That is still an important strength. In shipping, cash generation is what funds debt reduction, vessel upgrades, dividends, and flexibility during weaker markets. Star Bulk’s ability to remain cash generative even after peak conditions faded supports the case that the fleet is competitively positioned and not purely dependent on unusually high spot rates.
As for catalysts, one of the biggest is the industry supply backdrop. New vessel ordering has been constrained at times by shipyard capacity, financing discipline, and uncertainty around future fuel technologies. When fleet supply grows slowly and cargo demand remains firm, freight rates can strengthen quickly. Another catalyst is route dislocation: longer sailing distances caused by trade shifts or canal disruptions can tighten effective vessel supply by keeping ships occupied for more days per trip.
Recent company developments also matter. Star Bulk completed a merger with Eagle Bulk Shipping, adding more vessels and increasing exposure to the midsize dry bulk segment. That expands scale, broadens cargo and route exposure, and may create cost and commercial synergies over time. In an industry where scale supports negotiating power and utilization, that move is strategically meaningful.
Risks
This article is for informational purposes only and does not constitute financial advice. Some content is AI-generated. See Disclaimer


