Stock Analysis · Sharplink Gaming Ltd (SBET)
Overview
SharpLink Gaming Ltd is a small public company that has changed direction several times in recent years. Historically, it operated marketing and technology services connected to online sports betting and iGaming, helping gaming operators acquire and retain users through affiliate marketing, comparison tools, and performance-based digital campaigns. More recently, the company has also positioned itself around treasury and capital allocation activities tied to digital assets, which has made the business profile less straightforward than that of a traditional operating company.
Based on recent annual disclosures and investor communications, the operating business remains relatively small in revenue terms, while reported results can be heavily influenced by non-cash accounting movements and balance-sheet changes. That matters for long-term analysis because the company cannot be understood only through headline net income or short-term share moves; the underlying operating scale is still modest.
The company’s revenue mix is not disclosed in a highly detailed segment breakdown that would allow a precise source-by-source percentage split for every line of business. However, public filings indicate that the core operating revenue has primarily come from online gaming-related marketing and affiliate services, including performance marketing arrangements and media or technology-enabled customer acquisition activity. In practical terms, the revenue base appears concentrated in:
- Gaming affiliate and performance marketing services: the main disclosed operating activity, built around generating traffic, leads, and player referrals for sports betting and iGaming operators.
- Technology and related service activity: software, platform, or campaign-support capabilities tied to the gaming ecosystem, though this appears smaller and less separately disclosed.
- Other income or non-operating items: these can materially affect reported earnings, but they are not the same as stable recurring operating revenue.
One notable pattern over the last several years is that revenue has stayed in the low tens of millions of dollars or below, while expenses and earnings have been much more volatile. That suggests a company still searching for a durable operating model rather than one already running at mature scale.
The financial flow over time shows a business with narrow gross profit relative to overhead for most years. Selling, general, and administrative expense has often absorbed far more than the company’s gross profit, and 2025 stands out as an especially distorted year with a very large loss despite higher reported revenue.
Key Figures
| Metric | Value | Sector ⓘ |
|---|---|---|
| Date | Oct 17, 2026 | |
| Context | ||
| Sector | Financial Services | |
| Industry | Capital Markets | |
| Market Cap ⓘ | $1.72B | |
| Beta ⓘ | 10.59 | |
Value (Cheapness) | ||
| P/E Ratio ⓘ | N/A | 12.26 |
| P/B Ratio ⓘ | 1.22 | 1.23 |
| FCF Yield ⓘ | -1.97% | 10.40% |
| Dividend Yield ⓘ | N/A | 3.02% |
| EBIT / EV ⓘ | -30.17% | 8.14% |
| PEG ⓘ | N/A | |
Growth (Business expansion) | ||
| Revenue Growth ⓘ | 1553.90% | 9.35% |
| RPS Growth (5Y CAGR) ⓘ | -66.42% | 12.19% |
| EPS Growth (5Y CAGR) ⓘ | N/A | -9.53% |
| BVPS Growth (5Y CAGR) ⓘ | -32.82% | 4.99% |
| Margin Growth (5Y Trend) ⓘ | N/A | -3.86% |
| FCF Growth (5Y CAGR) ⓘ | N/A | 4.81% |
| DPS Growth (5Y CAGR) ⓘ | -64.65% | 8.79% |
Quality (Business durability) | ||
| ROIC (Latest) ⓘ | -21.55% | 9.49% |
| ROE (Latest) ⓘ | -76.36% | 13.90% |
| ROA (Latest) ⓘ | -76.19% | 1.55% |
| ROIC (5Y Median) ⓘ | -50.30% | 7.86% |
| ROE (5Y Median) ⓘ | -177.40% | 12.17% |
| ROA (5Y Median) ⓘ | -35.59% | 1.30% |
| Net Debt / EBIT (Latest) ⓘ | N/A | 0.96 |
| Net Debt / EBIT (5Y Median) ⓘ | N/A | 0.73 |
| Net Debt / EBITDA (Latest) ⓘ | N/A | 0.92 |
| Operating Margin (Latest) ⓘ | -1245.47% | 22.30% |
| Operating Margin (5Y Median) ⓘ | -401.14% | 24.63% |
| Debt to Equity (Latest) ⓘ | N/A | 58.56% |
| Profit Margin (Latest) ⓘ | N/A | 26.57% |
| Free Cash Flow (Latest) ⓘ | -$33.88M | |
Momentum (Price trend) | ||
| 3Y Return ⓘ | -57.13% | +88.33% |
| 12M Return (excl. last month) ⓘ | -50.39% | +19.38% |
| 6M Return ⓘ | +8.06% | +4.75% |
| Price vs. 200-Day MA ⓘ | +11.13% | +3.50% |
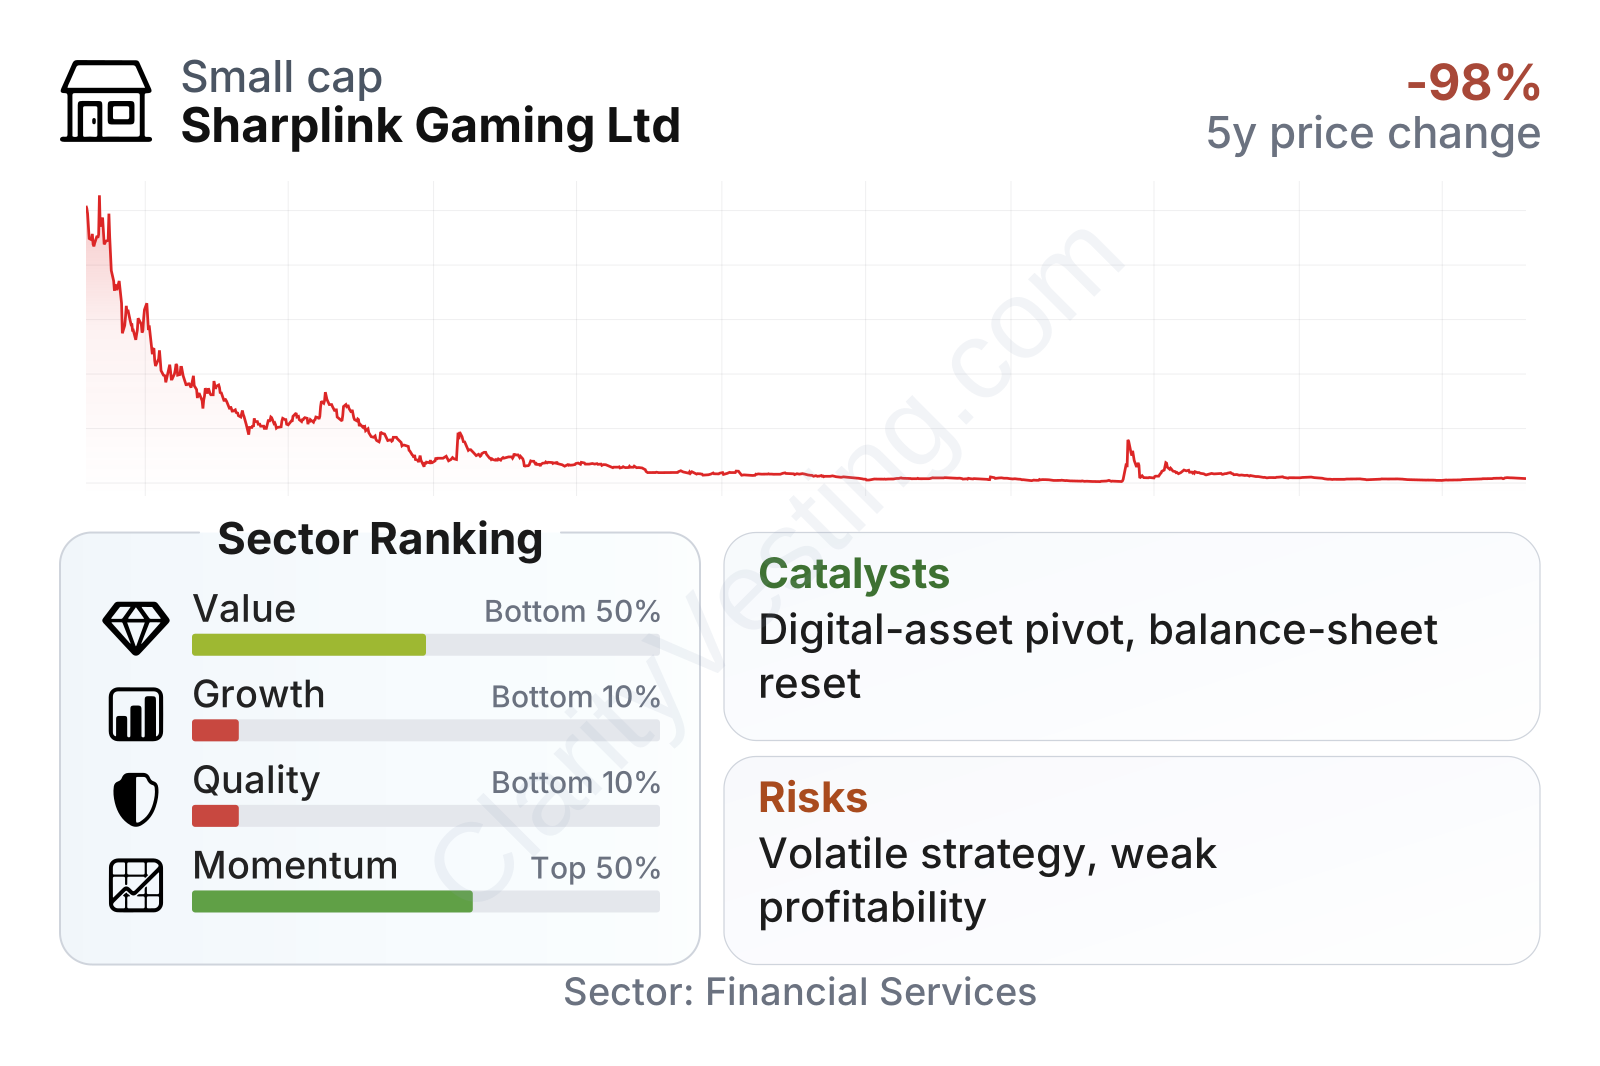
SharpLink’s profile is unusual. It is now a small-cap company by public-market standards, but its share price history has been exceptionally volatile, with a very steep multi-year decline followed by sharp rebounds. The latest factor snapshot points to weak growth and quality rankings versus most companies in its sector, while momentum has improved more recently. Valuation metrics are mixed: the price-to-book ratio is not extreme on its own, but weak profitability and negative free cash flow make traditional cheap-or-expensive judgments less reliable.
Growth
The broader online betting and iGaming ecosystem is still a growth market in many jurisdictions, especially where regulation is opening new states or countries to legal digital wagering. That gives companies tied to customer acquisition, traffic generation, and gaming-related technology a potential runway if they can build scale efficiently. On paper, SharpLink’s legacy focus on affiliate marketing fits into a sector with structural expansion.
The challenge is that sector growth has not automatically translated into consistent business growth for SharpLink. Recent yearly revenue growth has been strong in percentage terms, but the longer trend remains uneven and the company’s five-year revenue-per-share record is deeply negative. That usually means share count changes, business shifts, or operating instability have diluted the benefit of top-line expansion.
The earnings trend captures that instability well. Losses were substantial in prior years, worsened sharply in 2025, and then turned slightly positive on a trailing interim basis in 2026. That improvement is encouraging at a high level, but the scale is still too small to conclude that a stable earnings engine has been established.
Book value per share has also been highly volatile, including a period of negative equity followed by a recovery. For a long-term reader, this points less to steady compounding and more to a company undergoing repeated recapitalization and strategic resets. A stronger balance sheet can create optionality, but it does not by itself prove the operating model is working.
A meaningful catalyst is the company’s repositioning around digital-asset treasury management, which has drawn market attention and appears to be a major reason for the stock’s renewed visibility. If management can use that strategy to attract capital, strengthen the balance sheet, and then support a clearer business plan, it could create opportunities that did not exist under the older, smaller affiliate model. The key issue is whether this becomes a durable economic advantage or mostly a source of market excitement.
Risks
This article is for informational purposes only and does not constitute financial advice. Some content is AI-generated. See Disclaimer


