Stock Analysis · Seacoast Banking Corporation of Florida (SBCF)
Overview
Seacoast Banking Corporation of Florida is the parent company of Seacoast National Bank, a Florida-focused regional bank. It provides traditional banking services such as commercial and consumer loans, deposit accounts, treasury and cash-management tools, and wealth-related services. Its footprint is concentrated in Florida, one of the faster-growing banking markets in the United States because of population growth, business formation, and migration of households and companies into the state.
Like most regional banks, Seacoast earns most of its money from the spread between what it receives on loans and securities and what it pays on deposits and borrowings. It also generates fee income from service charges, wealth management, mortgage banking, and other customer services. Based on recent annual results, its revenue mix appears to be concentrated in the following areas:
- Net interest income: approximately 75% to 85%. This is the core banking engine and includes interest earned on commercial real estate, residential, commercial and industrial, and consumer loans, plus investment securities, minus interest paid on deposits and other funding.
- Wealth management and trust fees: approximately 5% to 10%. This includes advisory, fiduciary, and asset management services for individuals and businesses.
- Service charges and card-related fees: approximately 3% to 7%. These come from deposit account fees, interchange, treasury management, and related banking services.
- Mortgage banking and other noninterest income: approximately 5% to 10%. This includes mortgage-related income, capital markets-related banking fees, and other customer service revenue.
Over the last several years, total revenue has expanded materially, rising from roughly $355 million in 2021 to about $870 million in 2025. That growth has not translated cleanly into stronger profitability because interest expense and operating costs also climbed sharply as rates moved higher and the company continued to build scale.
The broad financial flow shows a bank that has become much larger in revenue terms, but with a meaningful share of that expansion absorbed by higher funding costs and operating expenses. Net income has improved from the 2023 trough, yet the business still looks more like a scale-up in progress than a fully optimized franchise.
Key Figures
| Metric | Value | Sector ⓘ |
|---|---|---|
| Date | Oct 17, 2026 | |
| Context | ||
| Sector | Financial Services | |
| Industry | Banks - Regional | |
| Market Cap ⓘ | $3.06B | |
| Beta ⓘ | 0.91 | |
Value (Cheapness) | ||
| P/E Ratio ⓘ | 20.42 | 12.26 |
| P/B Ratio ⓘ | 1.03 | 1.23 |
| FCF Yield ⓘ | 6.75% | 10.40% |
| Dividend Yield ⓘ | 2.37% | 3.02% |
| EBIT / EV ⓘ | 4.89% | 8.14% |
| PEG ⓘ | 1.58 | |
Growth (Business expansion) | ||
| Revenue Growth ⓘ | 38.30% | 9.35% |
| RPS Growth (5Y CAGR) ⓘ | 11.05% | 12.19% |
| EPS Growth (5Y CAGR) ⓘ | -13.52% | -9.53% |
| BVPS Growth (5Y CAGR) ⓘ | -33.34% | 4.99% |
| Margin Growth (5Y Trend) ⓘ | -23.27% | -3.86% |
| FCF Growth (5Y CAGR) ⓘ | 4.46% | 4.81% |
| DPS Growth (5Y CAGR) ⓘ | 16.92% | 8.79% |
Quality (Business durability) | ||
| ROIC (Latest) ⓘ | 4.59% | 9.49% |
| ROE (Latest) ⓘ | 5.95% | 13.90% |
| ROA (Latest) ⓘ | 0.85% | 1.55% |
| ROIC (5Y Median) ⓘ | 5.07% | 7.86% |
| ROE (5Y Median) ⓘ | 5.53% | 12.17% |
| ROA (5Y Median) ⓘ | 0.81% | 1.30% |
| Net Debt / EBIT (Latest) ⓘ | 5.44 | 0.96 |
| Net Debt / EBIT (5Y Median) ⓘ | 0.58 | 0.73 |
| Net Debt / EBITDA (Latest) ⓘ | 4.29 | 0.92 |
| Operating Margin (Latest) ⓘ | 21.82% | 22.30% |
| Operating Margin (5Y Median) ⓘ | 21.45% | 24.63% |
| Debt to Equity (Latest) ⓘ | 42.97% | 58.56% |
| Profit Margin (Latest) ⓘ | 23.77% | 26.57% |
| Free Cash Flow (Latest) ⓘ | $206.94M | |
Momentum (Price trend) | ||
| 3Y Return ⓘ | +67.60% | +88.33% |
| 12M Return (excl. last month) ⓘ | +15.27% | +19.38% |
| 6M Return ⓘ | +1.72% | +4.75% |
| Price vs. 200-Day MA ⓘ | +0.93% | +3.50% |
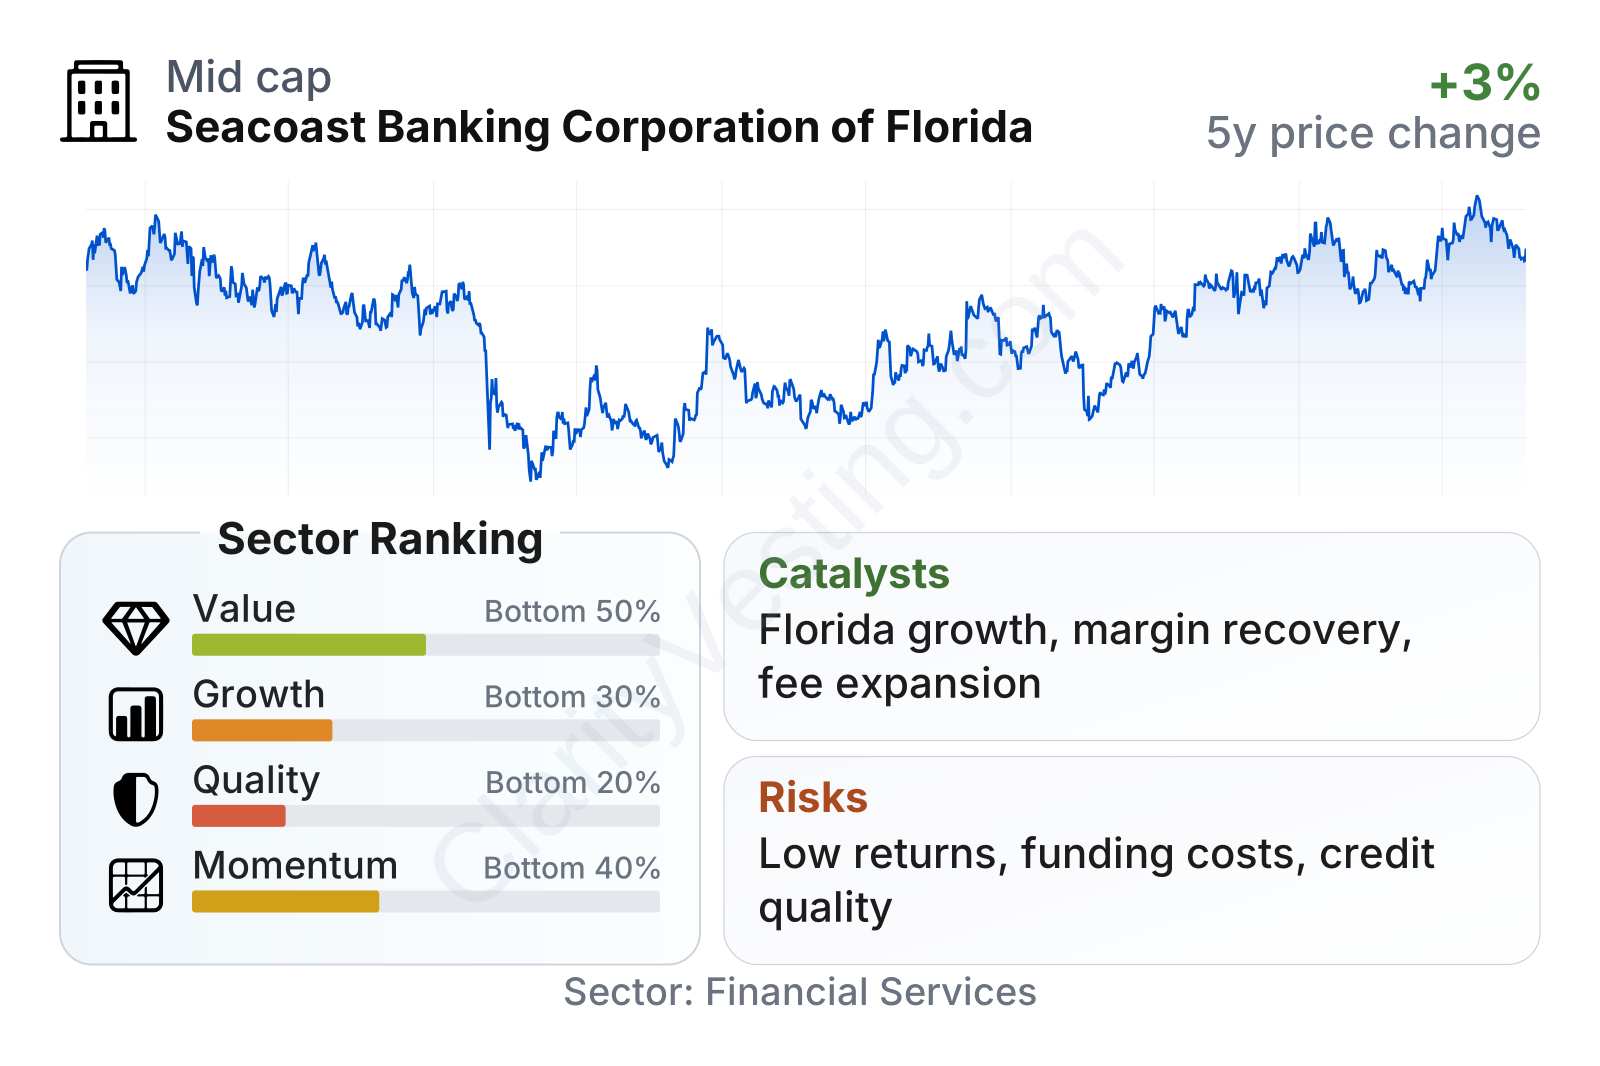
Seacoast sits in the regional bank category at roughly a mid-sized scale, with a market value a little above $3 billion and a beta below 1, which suggests the shares have been somewhat less volatile than the broader equity market. The factor breakdown is mixed. Growth looks weaker than many peers on a multi-year basis even though recent revenue growth was strong, while quality metrics rank in the lower part of the sector because returns on equity and assets remain below industry medians. Value metrics are not clearly cheap on earnings, but they look more moderate on book value.
The stock price path also reflects the regional banking cycle. Shares fell hard during the 2023 banking stress period, then recovered steadily through 2024, 2025, and into 2026. Even after that rebound, the operating profile still does not fully match the stronger regional-bank peers on profitability.
Growth
Seacoast operates in a market with favorable long-term background conditions. Florida has been one of the stronger states for population growth, small-business formation, and real estate activity. For a local and regional bank, that matters because more residents and businesses can mean more deposits, more loans, and more demand for treasury management, wealth advice, and payment services.
The company’s strategy has centered on building density in Florida, expanding commercial banking capabilities, and using acquisitions selectively to deepen its presence in attractive local markets. That general approach makes sense for a bank of its size: a larger branch and client network can improve funding stability, broaden cross-selling opportunities, and spread fixed costs across a bigger asset base. Seacoast has also been working to improve operating leverage over time, which means growing revenue faster than expenses.
A clear positive is that recent revenue momentum has been strong. Year-over-year revenue growth is well above the sector median, indicating that the franchise has been expanding faster than many peers recently. Total revenue has also trended higher over several years. However, the long-term picture is less clean because earnings per share and book value per share have been uneven.
Earnings per share show the pressure that many regional banks felt as deposit costs rose. After declining from 2021 through 2024, EPS improved in 2025, suggesting that margin pressure may be easing and that the bank is regaining some earnings traction. That said, the recovery is still incomplete rather than decisive.
Book value per share has also been volatile, which is important for banks because book value is a basic anchor for measuring capital strength and franchise value. The more recent rebound is constructive and likely reflects acquisition effects, retained earnings, and balance-sheet normalization, but the five-year trend remains weaker than the sector median.
One of the more relevant near-term catalysts is the possibility of a friendlier interest-rate environment for deposit costs. If funding pressure continues to moderate while loan yields stay relatively firm, Seacoast could see better net interest margin performance. Another opportunity is continued population and business migration into Florida, which supports long-term demand for commercial and consumer banking. The company has also highlighted expansion in fee-based businesses such as wealth management and treasury services, which can help diversify earnings away from pure lending spreads.
Risks
This article is for informational purposes only and does not constitute financial advice. Some content is AI-generated. See Disclaimer


