Stock Analysis · AB Sagax (SAGXF)
Overview
AB Sagax is a Swedish property company focused on commercial real estate, with a clear specialization in warehouse, light industrial, and other logistics-related buildings. Its business model is straightforward: it acquires properties, rents them out on relatively long leases, and aims to grow both rental income and property value over time. The company operates across several European countries and has built a portfolio centered on practical, lower-profile properties that are essential to tenants’ daily operations.
Its revenue is mainly recurring and comes primarily from rental activity rather than one-off development gains. Based on the company’s business model and public reporting, the main economic drivers are:
- Rental income from warehouse and light industrial properties: the large majority of recurring revenue, likely above 80%. This includes rent from logistics, industrial, and storage-oriented premises used by business tenants.
- Other property-related income: a smaller share, likely in the 5% to 15% range, including service charges, reimbursements, and related tenant payments where applicable.
- Value changes and financial items: these can have a major effect on profit in a given year, but they are not the same as core operating revenue. They reflect property revaluations, interest-related effects, and other financial movements that can make reported earnings more volatile.
Over the last several years, the company’s top line has moved upward steadily, while property-level costs and administrative expenses have remained relatively controlled compared with revenue. A notable feature is that profit can swing sharply from year to year because real estate companies often record gains or losses from changes in property values, even when rental operations remain stable.
The business mix points to a company with a solid recurring rent base. Revenue has expanded consistently from 2021 through 2025, while financing costs also rose as interest rates increased, which is an important factor for any leveraged property owner.
Key Figures
| Metric | Value | Sector ⓘ |
|---|---|---|
| Date | Nov 21, 2026 | |
| Context | ||
| Sector | Real Estate | |
| Industry | Real Estate Services | |
| Market Cap ⓘ | $8.91B | |
| Beta ⓘ | 1.44 | |
Value (Cheapness) | ||
| P/E Ratio ⓘ | 8.88 | 17.59 |
| P/B Ratio ⓘ | N/A | 1.58 |
| FCF Yield ⓘ | 2.19% | 5.76% |
| Dividend Yield ⓘ | N/A | 4.81% |
| EBIT / EV ⓘ | 7.72% | 4.97% |
| PEG ⓘ | N/A | |
Growth (Business expansion) | ||
| Revenue Growth ⓘ | 6.00% | 5.70% |
| RPS Growth (5Y CAGR) ⓘ | 13.38% | 5.96% |
| EPS Growth (5Y CAGR) ⓘ | -66.23% | -3.46% |
| BVPS Growth (5Y CAGR) ⓘ | 6.88% | 0.32% |
| Margin Growth (5Y Trend) ⓘ | 1.09% | -0.65% |
| FCF Growth (5Y CAGR) ⓘ | 10.87% | 5.08% |
| DPS Growth (5Y CAGR) ⓘ | 14.74% | 5.00% |
Quality (Business durability) | ||
| ROIC (Latest) ⓘ | 7.90% | 5.13% |
| ROE (Latest) ⓘ | 15.01% | 7.64% |
| ROA (Latest) ⓘ | 7.17% | 3.05% |
| ROIC (5Y Median) ⓘ | N/A | 4.20% |
| ROE (5Y Median) ⓘ | 9.71% | 6.03% |
| ROA (5Y Median) ⓘ | 4.69% | 2.41% |
| Net Debt / EBIT (Latest) ⓘ | 5.07 | 7.59 |
| Net Debt / EBIT (5Y Median) ⓘ | 7.80 | 8.34 |
| Net Debt / EBITDA (Latest) ⓘ | 5.07 | 5.43 |
| Net Debt / Assets ⓘ | 44.01% | 38.21% |
| EBITDA / Interest ⓘ | 6.94 | 4.20 |
| Operating Margin (Latest) ⓘ | 155.74% | 34.59% |
| Operating Margin (5Y Median) ⓘ | 101.27% | 37.64% |
| Debt to Equity (Latest) ⓘ | N/A | 90.32% |
| Profit Margin (Latest) ⓘ | 121.83% | 20.10% |
| Free Cash Flow (Latest) ⓘ | $195.64M | |
Momentum (Price trend) | ||
| 3Y Return ⓘ | -15.26% | +27.88% |
| 12M Return (excl. last month) ⓘ | +1.88% | +1.16% |
| 6M Return ⓘ | +2.51% | -3.06% |
| Price vs. 200-Day MA ⓘ | +2.54% | -0.73% |
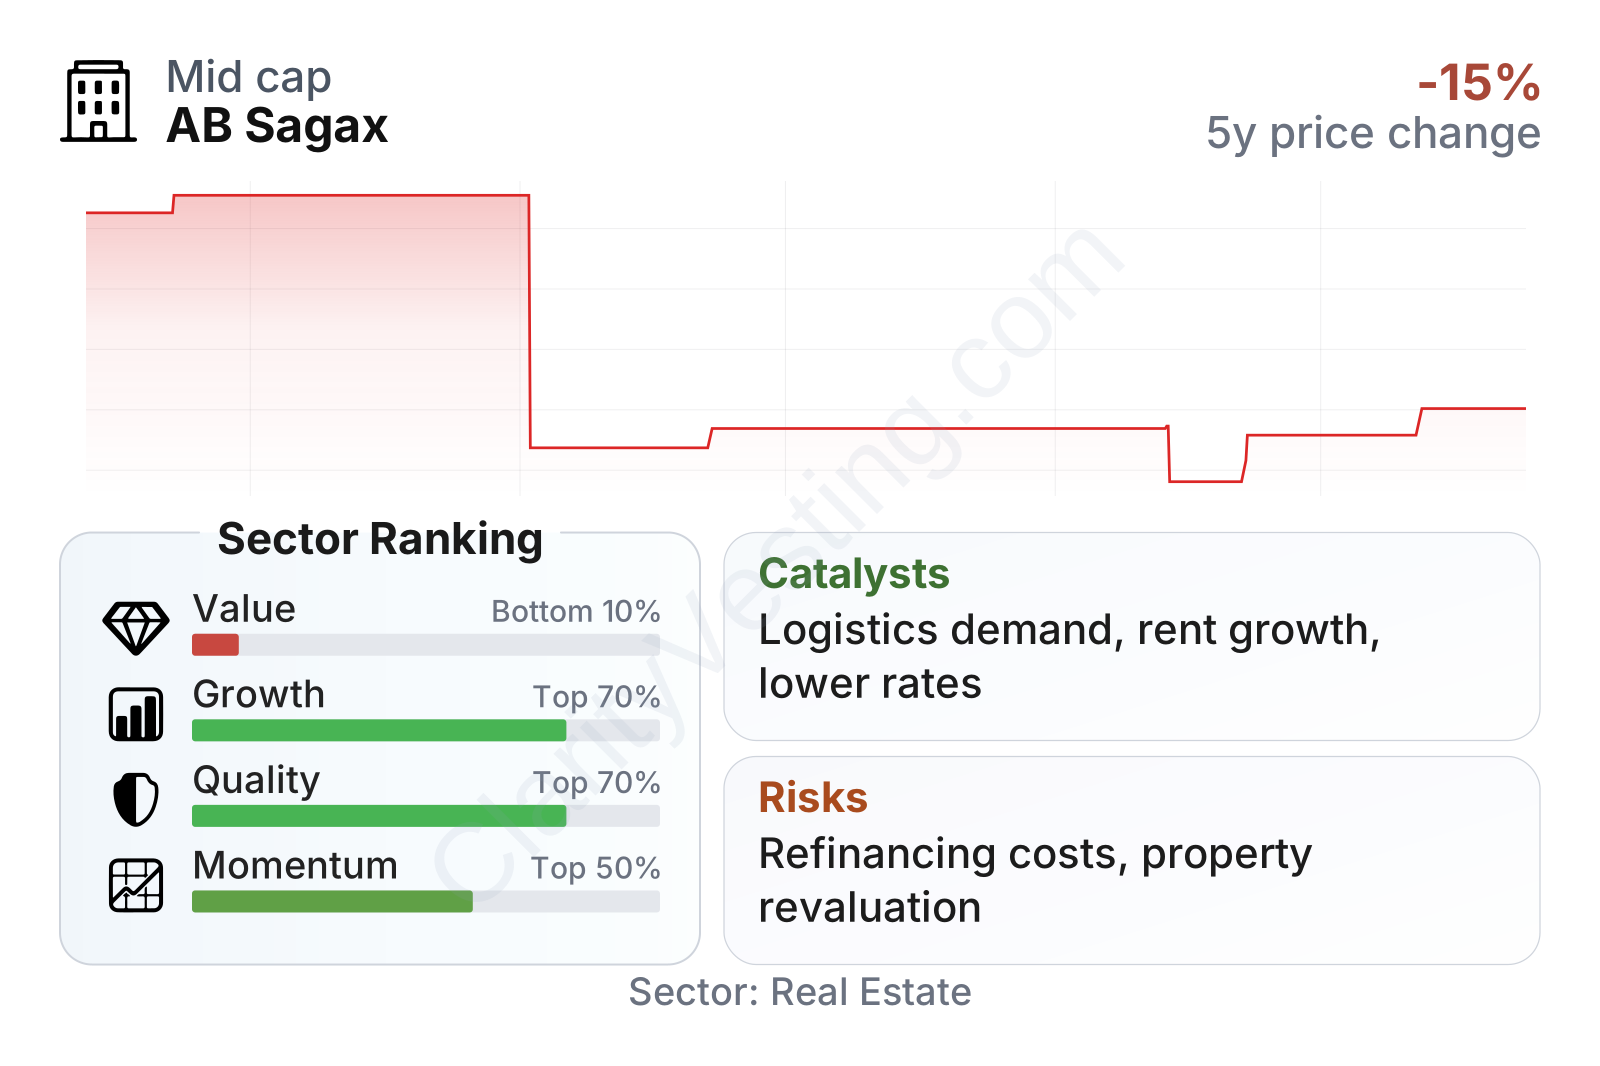
AB Sagax is a large listed real estate company, and the share price has been more volatile than many peers, as reflected by a beta above 1. The recent stock trend looks more stable than the weaker three-year picture, suggesting that sentiment has improved somewhat after a more difficult period for European property stocks.
The broader metrics show a mixed but understandable profile for a real estate business. On value measures, the company screens as inexpensive on earnings, with a price-to-earnings ratio well below the sector median, but not broadly cheap across every measure. Free cash flow yield is lower than the sector median, and the absence of a trailing dividend yield in the table means the stock does not stand out as an income name on that specific measure today.
On quality, the company compares well with much of the sector. Return on equity, return on assets, and return on invested capital are all above sector medians, and interest coverage is also stronger than many peers. Growth indicators are also favorable overall: revenue per share, free cash flow, book value per share, and dividend per share have all advanced meaningfully over five years, even though earnings per share have been distorted by the accounting volatility that is common in property valuation cycles.
Growth
AB Sagax operates in a part of real estate that has long-term structural support. Warehousing, urban distribution, light industrial space, and logistics-linked facilities benefit from e-commerce, supply-chain reconfiguration, and demand for well-located operational buildings. These assets are often less glamorous than office towers or luxury retail, but they can be resilient because tenants need them to move, store, and handle goods.
The company’s strategy also appears coherent for future growth. It focuses on specialized commercial properties across multiple European markets, which gives it geographic diversification while staying within a consistent property niche. That matters because scale and specialization can improve tenant knowledge, acquisition discipline, and property management efficiency.
The long-term operating trend is encouraging. Revenue per share has increased steadily each year from 2021 through 2025, which is a useful sign because it shows that growth has not relied only on issuing more shares. That pattern supports the view that the company has been expanding its rental base in a way that still creates more revenue on a per-share basis.
Dividend per share has also moved upward consistently over the same period. Even when a real estate company’s accounting earnings fluctuate, a rising dividend can indicate confidence in the underlying cash-generating capacity of the portfolio, provided leverage remains manageable.
Another favorable element is that recent annual revenue progression remained positive, roughly in line with or slightly above the sector median, while five-year revenue-per-share growth was materially stronger than the median. In practical terms, this suggests that AB Sagax has been able to combine asset growth with decent capital allocation.
As for current catalysts, the most visible one is the combination of improving market sentiment toward property shares and the company’s continued operating resilience. If financing conditions in Europe remain more stable than they were during the sharp interest-rate reset, companies with durable rental income and decent balance-sheet discipline could see pressure ease. Sagax also appears well positioned to benefit from ongoing demand for logistics and industrial space, especially in regions where supply is constrained.
Risks
This article is for informational purposes only and does not constitute financial advice. Some content is AI-generated. See Disclaimer