Stock Analysis · Ryerson Holding Corporation (RYZ)
Overview
Ryerson Holding Corporation is a metals service center and value-added processor. In simple terms, it buys large volumes of industrial metals, stores them, cuts and processes them to customer specifications, and then delivers those materials to manufacturers and fabricators. Its products are used in areas such as industrial machinery, transportation, construction, consumer durable goods, and general manufacturing.
The business model is built around three main functions: metal distribution, processing services, and supply-chain support. Customers often need more than raw material alone; they also need inventory availability, precision cutting, machining, fabrication support, and reliable delivery. That combination makes Ryerson more than a plain commodity reseller, even though metal prices still have a major effect on results.
Based on company filings, revenue is primarily generated from carbon steel, stainless steel, and aluminum products, with smaller contributions from other metals and fabrication-related services. A practical breakdown is:
- Carbon steel products: approximately 50% to 55% of revenue. This includes sheet, plate, bar, tube, and structural products used widely across manufacturing and construction.
- Aluminum products: approximately 20% to 25% of revenue. These products are commonly sold into transportation, industrial, and general fabrication markets.
- Stainless steel products: approximately 15% to 20% of revenue. These serve applications requiring corrosion resistance, including food equipment, industrial processing, and specialty manufacturing.
- Alloy, red metals, and other products and services: approximately 5% to 10% of revenue. This category includes specialty metals and value-added processing work.
Ryerson operates mainly in the United States, with additional operations in Canada, Mexico, and China. The company is mid-sized by public-market standards, and its large branch and processing network is an important part of how it serves customers quickly across many end markets.
The financial flow over the last several years shows a business that benefited strongly from the exceptional metals pricing environment of 2021 and 2022, then saw a clear normalization. Revenue remained substantial, but profits narrowed sharply as pricing and margins cooled, which is a key point for any long-term view.
Key Figures
| Metric | Value | Sector ⓘ |
|---|---|---|
| Date | Oct 17, 2026 | |
| Context | ||
| Sector | Industrials | |
| Industry | Metal Fabrication | |
| Market Cap ⓘ | $1.39B | |
| Beta ⓘ | 1.61 | |
Value (Cheapness) | ||
| P/E Ratio ⓘ | N/A | 22.10 |
| P/B Ratio ⓘ | 1.09 | 1.97 |
| FCF Yield ⓘ | -10.89% | 6.38% |
| Dividend Yield ⓘ | 2.85% | 1.94% |
| EBIT / EV ⓘ | 0.94% | 4.79% |
| PEG ⓘ | N/A | |
Growth (Business expansion) | ||
| Revenue Growth ⓘ | 71.60% | 9.30% |
| RPS Growth (5Y CAGR) ⓘ | -0.61% | 7.81% |
| EPS Growth (5Y CAGR) ⓘ | N/A | -13.06% |
| BVPS Growth (5Y CAGR) ⓘ | 13.76% | 6.14% |
| Margin Growth (5Y Trend) ⓘ | -8.43% | 0.88% |
| FCF Growth (5Y CAGR) ⓘ | N/A | 11.01% |
| DPS Growth (5Y CAGR) ⓘ | 46.15% | 9.48% |
Quality (Business durability) | ||
| ROIC (Latest) ⓘ | 0.39% | 10.84% |
| ROA (Latest) ⓘ | -1.03% | 5.41% |
| ROIC (5Y Median) ⓘ | N/A | 9.38% |
| ROA (5Y Median) ⓘ | 5.94% | 4.95% |
| Net Debt / EBIT (Latest) ⓘ | 53.34 | 2.08 |
| Net Debt / EBIT (5Y Median) ⓘ | 3.57 | 2.27 |
| Net Debt / EBITDA (Latest) ⓘ | 10.69 | 1.39 |
| Net Debt / Assets ⓘ | 33.46% | 19.28% |
| EBITDA / Interest ⓘ | 2.64 | 9.58 |
| Operating Margin (Latest) ⓘ | 0.41% | 10.50% |
| Operating Margin (5Y Median) ⓘ | 4.47% | 10.29% |
| Debt to Equity (Latest) ⓘ | 103.14% | 65.48% |
| Profit Margin (Latest) ⓘ | -0.56% | 6.67% |
| Free Cash Flow (Latest) ⓘ | -$151.80M | |
Momentum (Price trend) | ||
| 3Y Return ⓘ | +4.77% | +61.68% |
| 12M Return (excl. last month) ⓘ | +9.91% | +12.58% |
| 6M Return ⓘ | +8.74% | 0.00% |
| Price vs. 200-Day MA ⓘ | +1.90% | +0.02% |
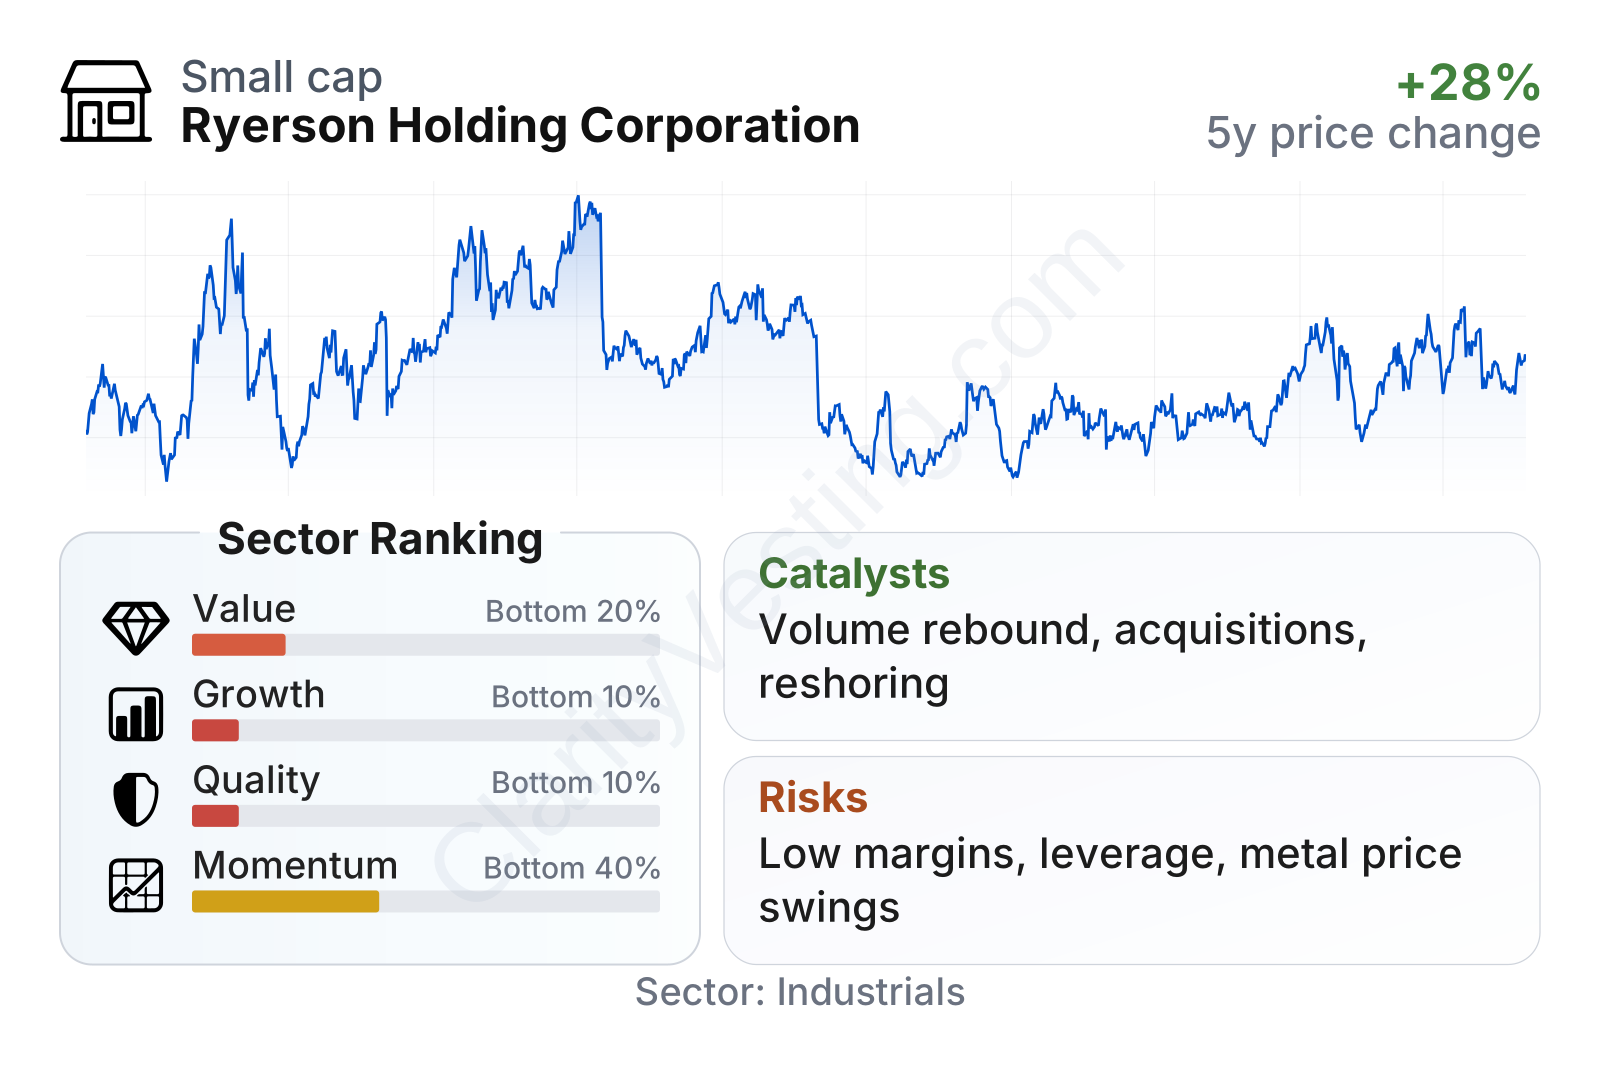
The stock has been volatile, which is not unusual for a cyclical industrial distributor tied to metal prices and manufacturing demand. The latest metrics show a mixed profile: valuation multiples on book value look lower than sector norms, but quality and growth rankings are weak relative to peers. That combination usually means the market is discounting earnings pressure, leverage, and inconsistent cash generation rather than simply overlooking the business.
Ryerson’s current profile stands out in three ways. First, recent revenue growth has rebounded sharply after a prolonged decline, suggesting an improvement from a weak base. Second, profitability remains under pressure, with margins and returns well below sector medians. Third, leverage metrics are elevated, so balance-sheet resilience matters more than usual at this point in the cycle.
Growth
Ryerson operates in a sector that is mature rather than structurally fast-growing. Metal distribution itself is not a high-growth industry in the way software or semiconductors can be. Long-term expansion usually comes from industrial production, infrastructure activity, reshoring of manufacturing, and taking share through service quality, acquisitions, and processing capabilities. That means growth is possible, but it tends to be cyclical and operational rather than explosive.
The company’s strategy is sensible for that kind of market. Ryerson has emphasized higher-value processing, digital tools for customers, and acquisitions that expand geographic reach or add specialized capabilities. In a fragmented service-center market, scale can matter: bigger networks can improve purchasing, inventory availability, logistics, and cross-selling. If management executes well, these advantages can support better customer retention and steadier volumes over time.
Recent sales trends suggest the business may be moving out of a weak period. Year-over-year revenue was negative for much of 2023 through 2025, then turned positive and accelerated sharply in the most recent periods. That kind of rebound can signal improving metal demand, better pricing, contribution from acquisitions, or a combination of all three. Even so, for a company like Ryerson, a single strong growth phase does not automatically mean a durable long-term trend, because volume and pricing can reverse when industrial conditions soften.
Cash generation is a more cautious part of the picture. Free cash flow has swung materially from positive to negative over the last few years. That is common in distribution businesses with large working-capital needs, especially when inventory, receivables, and metal prices move quickly. Still, for long-term analysis, sustainable growth matters more when it converts into consistently positive cash flow rather than staying tied to favorable market timing.
A meaningful catalyst is the broader North American manufacturing and infrastructure environment. If domestic industrial activity stays firm, Ryerson’s broad product portfolio and processing footprint could allow it to capture more demand without needing a radically different business model. In addition, acquisitions remain a realistic expansion tool because the industry is still populated by many regional and niche operators.
Recent company communications have also pointed to continued efforts to improve service offerings and operating efficiency. For Ryerson, that matters because modest gains in margin, inventory turns, and plant utilization can have an outsized effect on earnings when the cycle improves.
Risks
This article is for informational purposes only and does not constitute financial advice. Some content is AI-generated. See Disclaimer


