Stock Analysis · Ryman Healthcare Ltd (RYHTY)
Overview
Ryman Healthcare is a New Zealand-based operator and developer of retirement villages and aged-care facilities. The company focuses on housing, care, and health services for older residents, mainly in New Zealand and, to a smaller extent, Australia. Its model combines recurring operating income from village and care services with property-related earnings from developing new villages and reselling occupation rights when units turn over.
In simple terms, Ryman does not operate like a standard hospital or clinic business. It builds and runs retirement communities where residents can live independently, receive assisted living support, and move into higher-care settings if needed. That integrated model matters because it can create multiple revenue streams from the same site over many years.
The latest annual results indicate revenue is mainly generated from a mix of resident fees, care and accommodation income, and property-related income tied to occupation right agreements and unit turnover. Exact segment percentages are not always presented in a way that maps neatly into one simple public breakdown, but the business can be understood through the following main drivers:
- Village operating and resident service income — recurring fees from residents, accommodation charges, and everyday village services.
- Aged-care income — payments linked to rest-home, hospital, dementia, and assisted-living care services.
- Deferred management fees and resale-related gains — an important source of economics in the retirement village model, typically recognized when residents leave and units are relicensed.
- Development and expansion activity — earnings can also be influenced by newly opened units, care beds, and the pace of construction completions.
What stands out is that accounting profit can swing sharply because property valuations, development timing, and resale activity can have a major effect on reported earnings, even while cash generation and underlying village activity follow a different path.
The longer-term picture shows revenue moving up over recent years, but profitability has become much more volatile. Costs, interest expense, and weaker fair-value or property-related outcomes have put pressure on earnings, which helps explain why the business can look stronger on top-line growth than on bottom-line results.
Key Figures
| Metric | Value | Sector ⓘ |
|---|---|---|
| Date | Oct 17, 2026 | |
| Context | ||
| Sector | Healthcare | |
| Industry | Medical Care Facilities | |
| Market Cap ⓘ | $1.00B | |
| Beta ⓘ | 0.37 | |
Value (Cheapness) | ||
| P/E Ratio ⓘ | N/A | 24.79 |
| P/B Ratio ⓘ | 0.24 | 3.08 |
| FCF Yield ⓘ | 52.90% | 3.15% |
| Dividend Yield ⓘ | N/A | 1.94% |
| EBIT / EV ⓘ | -25.56% | 0.57% |
| PEG ⓘ | 2.46 | |
Growth (Business expansion) | ||
| Revenue Growth ⓘ | 11.90% | 7.45% |
| RPS Growth (5Y CAGR) ⓘ | 43.77% | 8.61% |
| EPS Growth (5Y CAGR) ⓘ | N/A | -17.81% |
| BVPS Growth (5Y CAGR) ⓘ | 32.80% | 3.72% |
| Margin Growth (5Y Trend) ⓘ | N/A | -0.62% |
| FCF Growth (5Y CAGR) ⓘ | -0.54% | 1.04% |
| DPS Growth (5Y CAGR) ⓘ | 32.03% | 6.77% |
Quality (Business durability) | ||
| ROIC (Latest) ⓘ | N/A | 3.24% |
| ROA (Latest) ⓘ | -4.87% | 3.01% |
| ROIC (5Y Median) ⓘ | -0.24% | 4.60% |
| ROA (5Y Median) ⓘ | 0.04% | 1.89% |
| Net Debt / EBIT (Latest) ⓘ | N/A | 1.34 |
| Net Debt / EBIT (5Y Median) ⓘ | N/A | 1.84 |
| Net Debt / EBITDA (Latest) ⓘ | N/A | 1.00 |
| Net Debt / Assets ⓘ | 12.90% | 5.45% |
| EBITDA / Interest ⓘ | N/A | 9.64 |
| Operating Margin (Latest) ⓘ | -19.17% | 9.27% |
| Operating Margin (5Y Median) ⓘ | -2.22% | 7.38% |
| Debt to Equity (Latest) ⓘ | 39.04% | 28.58% |
| Profit Margin (Latest) ⓘ | -20.05% | 3.59% |
| Free Cash Flow (Latest) ⓘ | $529.26M | |
Momentum (Price trend) | ||
| 3Y Return ⓘ | -72.44% | +42.80% |
| 12M Return (excl. last month) ⓘ | -12.59% | +18.50% |
| 6M Return ⓘ | -19.39% | +7.57% |
| Price vs. 200-Day MA ⓘ | -25.61% | +5.12% |
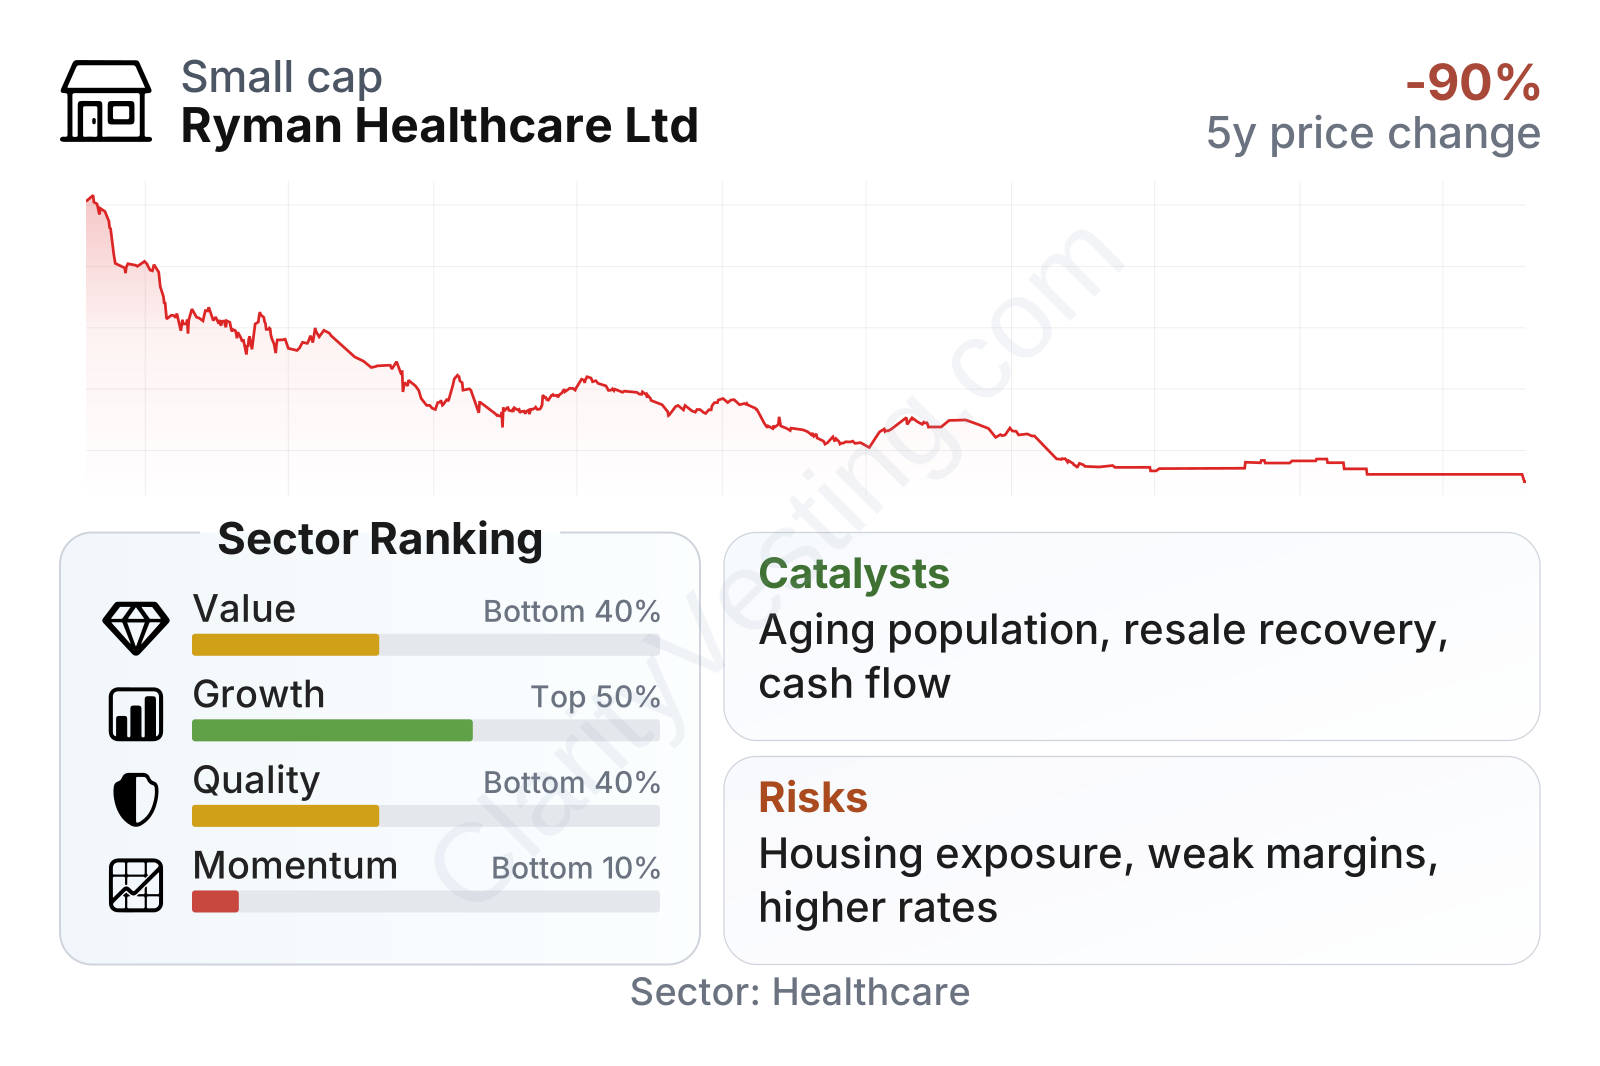
Ryman is a mid-sized healthcare and senior-living company by market value, and its share price performance has been very weak over the last several years. The factor profile is mixed: growth looks better than many healthcare peers, while quality, value ranking, and especially momentum look much weaker. The low beta suggests the stock has not moved as sharply as many equities in general, but that should not be confused with business stability, because earnings and margins have been under pressure.
The large gap between the company’s price-to-book ratio and the healthcare sector median suggests the market is placing a heavy discount on the asset base. At the same time, free cash flow measures look unusually strong, so the key question is whether that cash conversion is durable or influenced by working-capital and development-cycle effects rather than a stable improvement in core economics.
Growth
Ryman operates in a sector with a clear structural tailwind: aging populations. New Zealand and Australia both face rising demand for retirement living, assisted living, and higher-acuity aged care over the long term. That broad demographic backdrop is one of the strongest arguments for continued demand, especially for established operators with recognized brands, land banks, and operating experience.
The company’s strategy also makes sense in principle. It aims to develop integrated retirement villages that serve residents across different care needs, which can support occupancy, resident retention, and higher lifetime economics per resident. This model can be hard to replicate quickly because it requires development expertise, clinical operations, regulatory compliance, and access to suitable sites.
Recent revenue growth has been ahead of the healthcare sector median, with year-over-year growth around the high-single-digit to low-double-digit range. Over a five-year period, revenue per share growth and book value per share growth have also been much stronger than the sector median. That indicates the platform itself has continued to expand even though reported earnings have deteriorated.
Free cash flow remains one of the more constructive elements in the current profile, holding at a high level on a trailing basis. This matters because retirement village operators often need substantial capital for development, and internally generated cash can help reduce reliance on external funding. If the company can preserve cash generation while slowing cost growth and improving village turnover, that would strengthen the case that the recent profit weakness is at least partly cyclical rather than purely structural.
A relevant catalyst has been the company’s continued effort to reset its development pace, capital allocation, and balance sheet after a difficult operating period. In an environment where construction inflation and interest rates have been challenging, a more disciplined pipeline could improve returns on future projects. Any improvement in New Zealand housing-market conditions could also support resale activity and deferred management fee realization, both of which are meaningful for this business model.
Risks
This article is for informational purposes only and does not constitute financial advice. Some content is AI-generated. See Disclaimer


