Stock Analysis · Ryan Specialty Group Holdings Inc (RYAN)
Overview
Ryan Specialty Group Holdings Inc is a specialty insurance services company. In simple terms, it helps insurance brokers and carriers place complex or unusual risks that standard insurance markets may not want to cover directly. The company focuses on areas where expertise matters, such as professional liability, property risks exposed to natural catastrophes, transportation, casualty, marine, management liability, and delegated underwriting programs.
Its business is built around fee-based insurance distribution rather than taking large underwriting risk on its own balance sheet like a traditional insurer. That matters because the model can be more scalable and less exposed to direct claims volatility. Ryan Specialty mainly earns commissions and fees for arranging coverage, managing underwriting programs, and providing related services to brokers, agents, carriers, and policyholders.
Based on recent company filings, revenue is concentrated in two main operating groups:
- Wholesale Brokerage: approximately 75% to 80% of revenue. This is the largest activity. It places specialized insurance and reinsurance risks for retail brokers into the excess and surplus market and other specialty channels.
- Underwriting Managers: approximately 20% to 25% of revenue. This segment includes delegated underwriting authority businesses, often called MGUs or program administrators, that design, price, and administer specialty insurance programs on behalf of carriers.
Within those activities, Ryan Specialty is diversified across many niche lines of business rather than depending on one single insurance category. That diversification helps reduce exposure to weakness in any one product line, while still keeping the company focused on higher-margin specialty markets.
The business has expanded quickly in recent years. Revenue climbed from about $1.4 billion in 2021 to more than $2.5 billion in 2024, and the latest annual figures indicate revenue moving above $3.0 billion. Operating income also increased over that period, showing that scale has been improving alongside sales. Net income has been more uneven than revenue because interest expense, acquisition-related items, and other costs have taken a meaningful share of earnings.
The profit flow shows a business that has been adding revenue steadily and lifting operating income over time, but also one where selling, administrative, and financing costs remain important. In other words, the core franchise is growing, yet reported earnings are still influenced by debt and deal-related expenses.
Key Figures
| Metric | Value | Sector ⓘ |
|---|---|---|
| Date | Oct 24, 2026 | |
| Context | ||
| Sector | Financial Services | |
| Industry | Insurance Brokers | |
| Market Cap ⓘ | $10.83B | |
| Beta ⓘ | 0.60 | |
Value (Cheapness) | ||
| P/E Ratio ⓘ | 59.52 | 12.46 |
| P/B Ratio ⓘ | 2,177.67 | 1.25 |
| FCF Yield ⓘ | 4.59% | 9.82% |
| Dividend Yield ⓘ | 1.17% | 2.94% |
| EBIT / EV ⓘ | 6.24% | 8.11% |
| PEG ⓘ | N/A | |
Growth (Business expansion) | ||
| Revenue Growth ⓘ | 7.40% | 9.10% |
| RPS Growth (5Y CAGR) ⓘ | -5.18% | 12.31% |
| EPS Growth (5Y CAGR) ⓘ | 1.37% | -6.97% |
| BVPS Growth (5Y CAGR) ⓘ | -59.51% | 5.02% |
| Margin Growth (5Y Trend) ⓘ | 7.06% | -4.00% |
| FCF Growth (5Y CAGR) ⓘ | 21.55% | 4.71% |
| DPS Growth (5Y CAGR) ⓘ | -15.81% | 8.92% |
Quality (Business durability) | ||
| ROIC (Latest) ⓘ | 10.62% | 9.18% |
| ROE (Latest) ⓘ | 32.99% | 13.93% |
| ROA (Latest) ⓘ | 1.72% | 1.57% |
| ROIC (5Y Median) ⓘ | 11.27% | 7.80% |
| ROE (5Y Median) ⓘ | 15.94% | 12.15% |
| ROA (5Y Median) ⓘ | 1.03% | 1.28% |
| Net Debt / EBIT (Latest) ⓘ | 7.27 | 1.02 |
| Net Debt / EBIT (5Y Median) ⓘ | 6.54 | 0.72 |
| Net Debt / EBITDA (Latest) ⓘ | 4.64 | 0.88 |
| Operating Margin (Latest) ⓘ | 15.68% | 22.30% |
| Operating Margin (5Y Median) ⓘ | 16.90% | 24.50% |
| Debt to Equity (Latest) ⓘ | 747.44% | 59.34% |
| Profit Margin (Latest) ⓘ | 3.13% | 26.42% |
| Free Cash Flow (Latest) ⓘ | $496.69M | |
Momentum (Price trend) | ||
| 3Y Return ⓘ | +1.82% | +95.73% |
| 12M Return (excl. last month) ⓘ | -27.79% | +17.30% |
| 6M Return ⓘ | +23.49% | +6.07% |
| Price vs. 200-Day MA ⓘ | +14.07% | +5.36% |
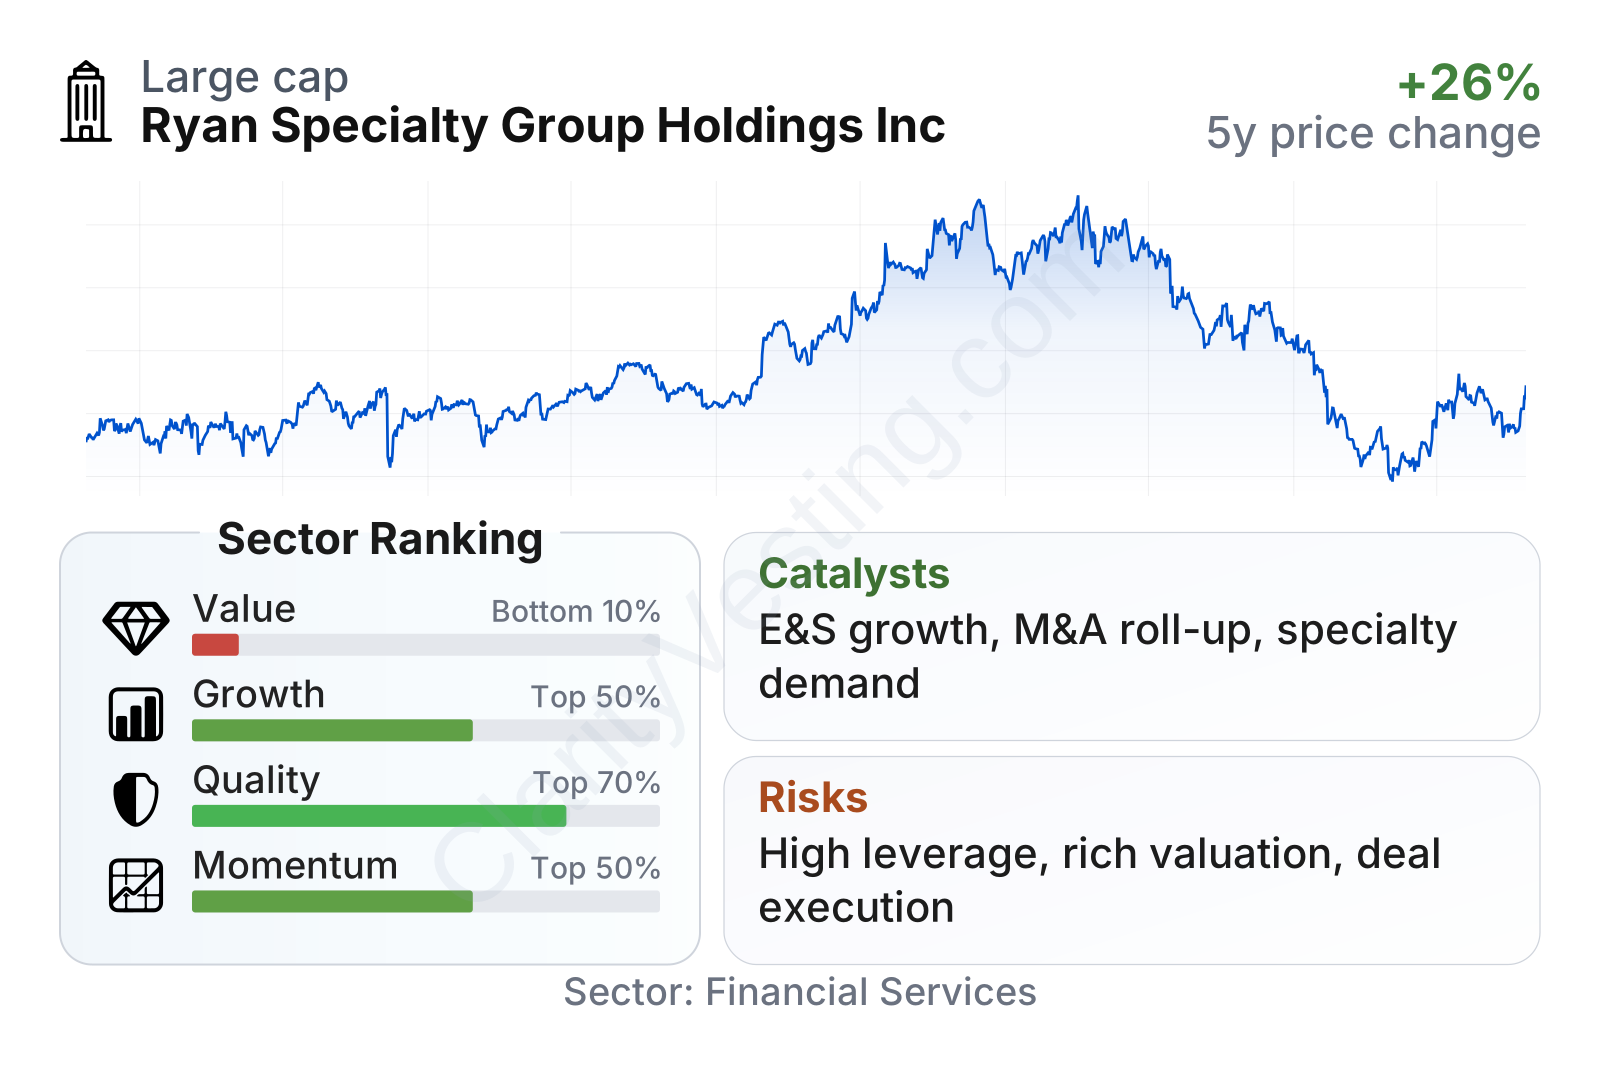
Ryan Specialty is a mid-to-large player in insurance distribution with a market value around $10 billion and a relatively low beta, meaning its share price has historically moved less than the broader market. The overall factor profile is mixed. Quality metrics are solid versus the sector, helped by good returns on invested capital and strong cash generation, while value metrics rank poorly because the stock trades at much richer multiples than most financial companies. Momentum has also been weak over longer periods despite a partial rebound in recent months.
The stock price history shows a strong rise through 2024 followed by a sharp pullback in 2025 and early 2026. That reset has reduced some of the market’s earlier enthusiasm, but the shares still trade on elevated earnings and book-based multiples compared with sector norms.
Growth
Ryan Specialty operates in a part of the insurance market that has favorable long-term characteristics. Specialty insurance tends to benefit from rising risk complexity, stricter underwriting, more frequent climate-related exposures, cyber and professional liability needs, and a broad shift by carriers toward excess and surplus lines for harder-to-place risks. These trends generally support demand for expert intermediaries that can match difficult risks with available capacity.
The company’s strategy is also consistent with how this sector grows. Ryan Specialty combines organic expansion with acquisitions, adds specialist teams, and deepens relationships with retail brokers and insurance carriers. Scale matters in this market because brokers value market access, product breadth, and specialist knowledge. A larger platform can also help attract talent, which is especially important in specialty insurance.
Earnings per share have moved upward over the last several years, rising from a little above $1.00 in 2021 to close to $2.00 in 2025. That progression suggests the business has been converting growth into better per-share profitability, even if not in a perfectly smooth line.
Free cash flow growth has been particularly notable, running well ahead of the sector median over a five-year view. That is an encouraging signal because it suggests the company’s expansion is not only accounting-based; it is also producing real cash that can support acquisitions, debt service, and selective shareholder returns.
Book value per share is a less flattering measure here. It has been volatile and has fallen sharply over the longer period, reflecting the effects of acquisitions, intangible-heavy accounting, leverage, and capital structure choices. For a broker that grows by deals, book value is less informative than revenue growth, margin development, and cash generation, but the trend still deserves attention.
A key catalyst for future growth is continued consolidation in specialty distribution. Many smaller specialty firms still exist, and Ryan Specialty has shown it can fold niche capabilities into a broader platform. Another catalyst is the ongoing need for complex insurance placement as standard carriers remain selective in property catastrophe, casualty, and other difficult lines. Recent company communications have also pointed to continued investment in delegated underwriting capabilities and specialty expertise, which can widen its role beyond straightforward brokerage.
Risks
This article is for informational purposes only and does not constitute financial advice. Some content is AI-generated. See Disclaimer


