Stock Analysis · Royce Value Closed Fund (RVT)
Overview
Royce Value Closed Fund is a closed-end investment fund managed within the Royce investment platform, which is known for specializing in small-cap investing. Rather than selling products or operating factories, the fund’s business is to own a portfolio of stocks. Its results depend mainly on how those investments perform over time and on the income they produce. The portfolio is primarily focused on U.S. small-cap value equities, so the fund gives shareholders exposure to a broad collection of smaller publicly traded companies rather than to one operating business.
Because RVT is a closed-end fund, its shares trade on the stock market independently from the value of the securities it owns. That matters for long-term analysis: performance comes from two layers, the underlying portfolio’s net asset value and the market price investors are willing to pay for the fund itself. This structure can create periods when the shares trade below the value of the portfolio and periods when that discount narrows.
The fund’s economic inflows are usually driven by investment-related sources rather than by traditional operating revenue streams. Based on the structure of a listed equity fund, the main sources are generally:
- Net realized and unrealized gains on investments: typically the largest driver over time, but highly variable from year to year because it depends on stock market conditions and portfolio decisions.
- Dividend income from portfolio holdings: cash distributions received from the companies owned in the fund.
- Interest and other investment income: usually a smaller contribution, including income from cash balances or short-term instruments when applicable.
Reported results show how volatile this model can be. The fund moved from strong profitability in 2021 to a large loss in 2022, then back to positive earnings in subsequent periods as equity markets improved. Expenses appear modest relative to assets, which is typical for an investment vehicle where returns are driven more by portfolio valuation changes than by operational scale.
The income profile is unusually sensitive to market swings: operating costs have remained comparatively contained, while overall profitability has been dominated by gains and losses in the investment portfolio. That is important for readers looking at long-term ownership, because RVT is less a business with steady sales growth and more a publicly traded wrapper around a small-cap value portfolio.
Key Figures
| Metric | Value | Sector ⓘ |
|---|---|---|
| Date | Oct 17, 2026 | |
| Context | ||
| Sector | Financial Services | |
| Industry | Asset Management | |
| Market Cap ⓘ | $2.03B | |
| Beta ⓘ | 1.26 | |
Value (Cheapness) | ||
| P/E Ratio ⓘ | 23.39 | 12.26 |
| P/B Ratio ⓘ | 0.78 | 1.23 |
| FCF Yield ⓘ | 2.16% | 10.40% |
| Dividend Yield ⓘ | 8.59% | 3.02% |
| EBIT / EV ⓘ | N/A | 8.14% |
| PEG ⓘ | N/A | |
Growth (Business expansion) | ||
| Revenue Growth ⓘ | 15.00% | 9.35% |
| RPS Growth (5Y CAGR) ⓘ | -16.87% | 12.19% |
| EPS Growth (5Y CAGR) ⓘ | -37.03% | -9.53% |
| BVPS Growth (5Y CAGR) ⓘ | -3.56% | 4.99% |
| Margin Growth (5Y Trend) ⓘ | 142.72% | -3.86% |
| FCF Growth (5Y CAGR) ⓘ | -51.76% | 4.81% |
| DPS Growth (5Y CAGR) ⓘ | -4.76% | 8.79% |
Quality (Business durability) | ||
| ROIC (Latest) ⓘ | N/A | 9.49% |
| ROE (Latest) ⓘ | 39.51% | 13.90% |
| ROA (Latest) ⓘ | 39.13% | 1.55% |
| ROIC (5Y Median) ⓘ | 17.35% | 7.86% |
| ROE (5Y Median) ⓘ | 12.60% | 12.17% |
| ROA (5Y Median) ⓘ | 12.47% | 1.30% |
| Net Debt / EBIT (Latest) ⓘ | N/A | 0.96 |
| Net Debt / EBIT (5Y Median) ⓘ | N/A | 0.73 |
| Net Debt / EBITDA (Latest) ⓘ | -0.00 | 0.92 |
| Operating Margin (Latest) ⓘ | N/A | 22.30% |
| Operating Margin (5Y Median) ⓘ | 100.13% | 24.63% |
| Debt to Equity (Latest) ⓘ | N/A | 58.56% |
| Profit Margin (Latest) ⓘ | 2488.63% | 26.57% |
| Free Cash Flow (Latest) ⓘ | $43.99M | |
Momentum (Price trend) | ||
| 3Y Return ⓘ | +68.89% | +88.33% |
| 12M Return (excl. last month) ⓘ | +17.11% | +19.38% |
| 6M Return ⓘ | -4.34% | +4.75% |
| Price vs. 200-Day MA ⓘ | -3.73% | +3.50% |
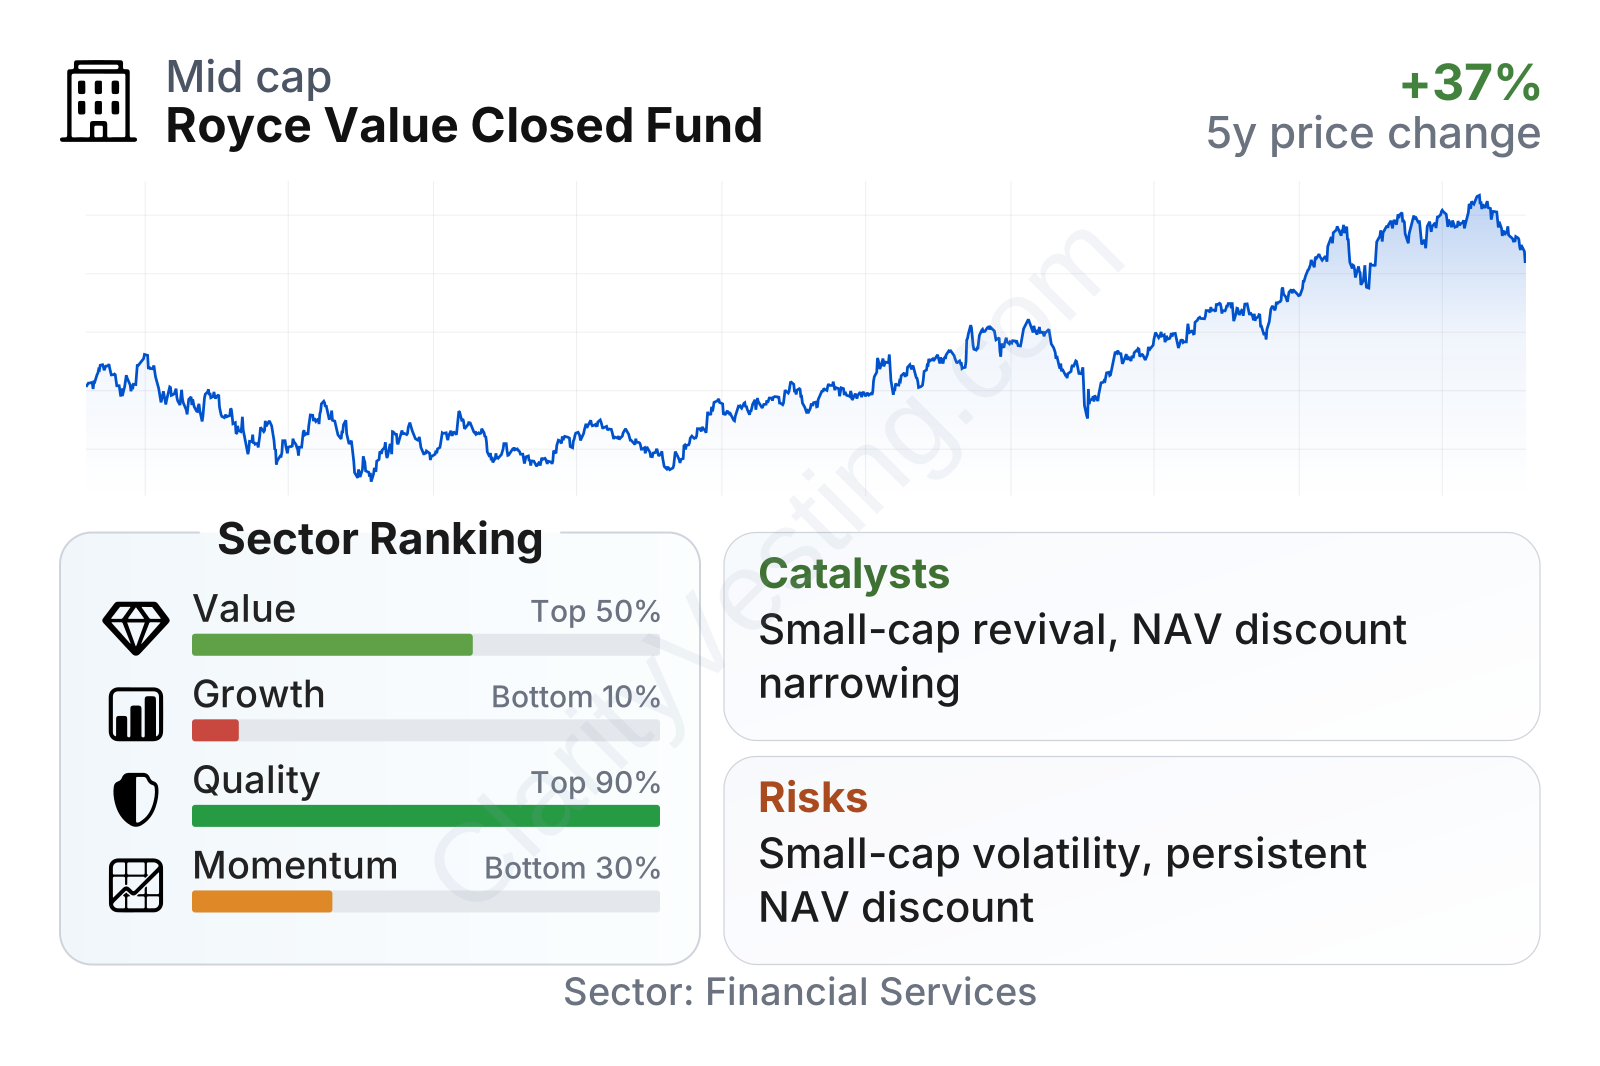
RVT stands out as a mid-sized listed fund with a relatively elevated share-price sensitivity to market moves, as suggested by a beta above 1.0. The most notable features in the current metrics are a low earnings multiple, a price-to-book ratio below much of the broader financial sector, and a dividend yield around 8%, which is materially higher than the sector median. Quality metrics look very strong on the surface, with returns on equity and assets well above sector norms, but investors need to interpret these carefully because closed-end fund accounting can make profitability ratios look very different from those of operating companies. The weak point is growth: five-year trends for earnings, book value per share, and revenue per share have generally lagged the sector, which fits the reality of a market-driven fund rather than a steadily compounding operating business.
The share price has also rebounded strongly from the 2022 downturn and has reached levels well above where it traded a few years ago. Even so, its longer-run momentum remains less impressive than some peers in financial services, reflecting the uneven path of small-cap value investing.
Growth
RVT operates in asset management, but its real growth exposure comes from the small-cap value segment of the stock market. That part of the market can benefit when economic activity broadens, financing conditions improve, and investors rotate away from a narrow group of large-cap winners toward cheaper, more cyclical companies. In that sense, the sector opportunity is not tied to fund sales growth in the usual way; it is tied to whether small-cap value stocks regain stronger relative performance.
The strategy has a clear long-term logic. Smaller companies have historically offered more room for business improvement, acquisition interest, and valuation re-rating than mature large-cap businesses. Royce’s specialization in this area is relevant because small-cap investing requires deeper research coverage and can reward active stock selection more than heavily covered mega-cap segments. If the market environment becomes friendlier to value stocks and to domestically oriented smaller businesses, RVT is positioned to reflect that through higher net asset value.
Earnings have been highly cyclical rather than steadily upward. The sharp loss in 2022 and the return to positive results afterward show that short-term profit trends say more about market conditions than about a durable operating growth engine. For a fund like RVT, a more useful long-term lens is whether the portfolio can rebuild value over full cycles instead of expecting smooth annual earnings expansion.
Book value per share recovered after the 2022 setback and has continued moving higher through more recent periods, although the five-year trend still looks softer than the broader sector median. That partial recovery matters because book value is one of the clearest markers of whether the underlying portfolio is compounding again. A sustained rise here would be a more meaningful signal than one strong earnings quarter.
A practical catalyst is the closed-end fund structure itself. If the underlying portfolio performs well while the market price still trades at a discount to net asset value, shareholders can benefit from both portfolio appreciation and discount narrowing. In addition, if small-cap value returns improve after a long period of underperformance versus large-cap growth, that style shift could provide a meaningful tailwind. Recent market behavior, including stronger price performance over the last year than the sector median in some shorter periods, suggests the fund has participated in a more constructive backdrop.
Risks
This article is for informational purposes only and does not constitute financial advice. Some content is AI-generated. See Disclaimer


