Stock Analysis · Revolution Medicines Inc (RVMD)
Overview
Revolution Medicines is a biotechnology company focused on cancer drugs designed to target some of the most important mutation-driven pathways in oncology, especially RAS-related cancers. In simple terms, the company is trying to build medicines for tumors driven by mutations such as KRAS, a target long considered difficult to treat. Its pipeline includes programs aimed at RAS(ON) inhibitors and combination approaches for cancers such as non-small cell lung cancer, pancreatic cancer, and colorectal cancer.
This is still a development-stage business. That matters because the company does not yet operate like a mature pharmaceutical company with a broad base of recurring product sales. Its economic profile is driven mainly by research activity, partnerships, and heavy spending to advance clinical trials. Revenue can therefore be uneven from year to year, while expenses remain high as multiple drug candidates move through testing.
Based on recent company filings, the business currently relies on a very narrow revenue base. The main sources are:
- Collaboration and license revenue: historically the primary source, representing essentially nearly 100% of reported revenue when revenue is present. This generally includes upfront payments, milestone-related recognition, and revenue recognized from research or licensing agreements.
- Product revenue: 0% at this stage. The company does not yet have a marketed commercial product generating recurring sales.
- Other revenue sources: not meaningful at this point based on current public filings.
The broad financial pattern is easy to understand: limited or irregular revenue, rapidly rising research and development expense, and sizable losses as the company funds a large oncology pipeline. Over the last several years, research spending has expanded sharply, which is typical for a biotech firm moving more programs into later-stage development, but it also means the company’s value depends heavily on future clinical success rather than present-day operating profits.
The operating profile shows a company that has prioritized research expansion over near-term profitability. Research and development has become the dominant use of cash, while revenue has remained minimal or absent in recent periods, underscoring how dependent the current valuation is on pipeline expectations rather than established sales.
Key Figures
| Metric | Value | Sector ⓘ |
|---|---|---|
| Date | Oct 24, 2026 | |
| Context | ||
| Sector | Healthcare | |
| Industry | Biotechnology | |
| Market Cap ⓘ | $41.64B | |
| Beta ⓘ | 1.40 | |
Value (Cheapness) | ||
| P/E Ratio ⓘ | N/A | 25.42 |
| P/B Ratio ⓘ | 15.19 | 3.08 |
| FCF Yield ⓘ | -2.96% | 3.12% |
| Dividend Yield ⓘ | N/A | 1.85% |
| EBIT / EV ⓘ | -4.55% | 0.56% |
| PEG ⓘ | N/A | |
Growth (Business expansion) | ||
| Revenue Growth ⓘ | -95.20% | 7.50% |
| RPS Growth (5Y CAGR) ⓘ | N/A | 8.60% |
| EPS Growth (5Y CAGR) ⓘ | N/A | -17.73% |
| BVPS Growth (5Y CAGR) ⓘ | 0.90% | 3.72% |
| Margin Growth (5Y Trend) ⓘ | N/A | -0.57% |
| FCF Growth (5Y CAGR) ⓘ | N/A | 0.96% |
| DPS Growth (5Y CAGR) ⓘ | N/A | 6.69% |
Quality (Business durability) | ||
| ROIC (Latest) ⓘ | -68.17% | 3.17% |
| ROA (Latest) ⓘ | -53.79% | 2.98% |
| ROIC (5Y Median) ⓘ | -27.31% | 4.56% |
| ROA (5Y Median) ⓘ | -30.37% | 1.87% |
| Net Debt / EBIT (Latest) ⓘ | N/A | 1.34 |
| Net Debt / EBIT (5Y Median) ⓘ | N/A | 1.86 |
| Net Debt / EBITDA (Latest) ⓘ | N/A | 1.00 |
| Net Debt / Assets ⓘ | -4.01% | 5.06% |
| EBITDA / Interest ⓘ | N/A | 9.55 |
| Operating Margin (Latest) ⓘ | N/A | 9.25% |
| Operating Margin (5Y Median) ⓘ | -704.14% | 7.33% |
| Debt to Equity (Latest) ⓘ | 24.63% | 26.68% |
| Profit Margin (Latest) ⓘ | N/A | 3.34% |
| Free Cash Flow (Latest) ⓘ | -$1.23B | |
Momentum (Price trend) | ||
| 3Y Return ⓘ | +922.56% | +51.61% |
| 12M Return (excl. last month) ⓘ | +334.27% | +19.90% |
| 6M Return ⓘ | +32.64% | +10.10% |
| Price vs. 200-Day MA ⓘ | +22.01% | +6.44% |
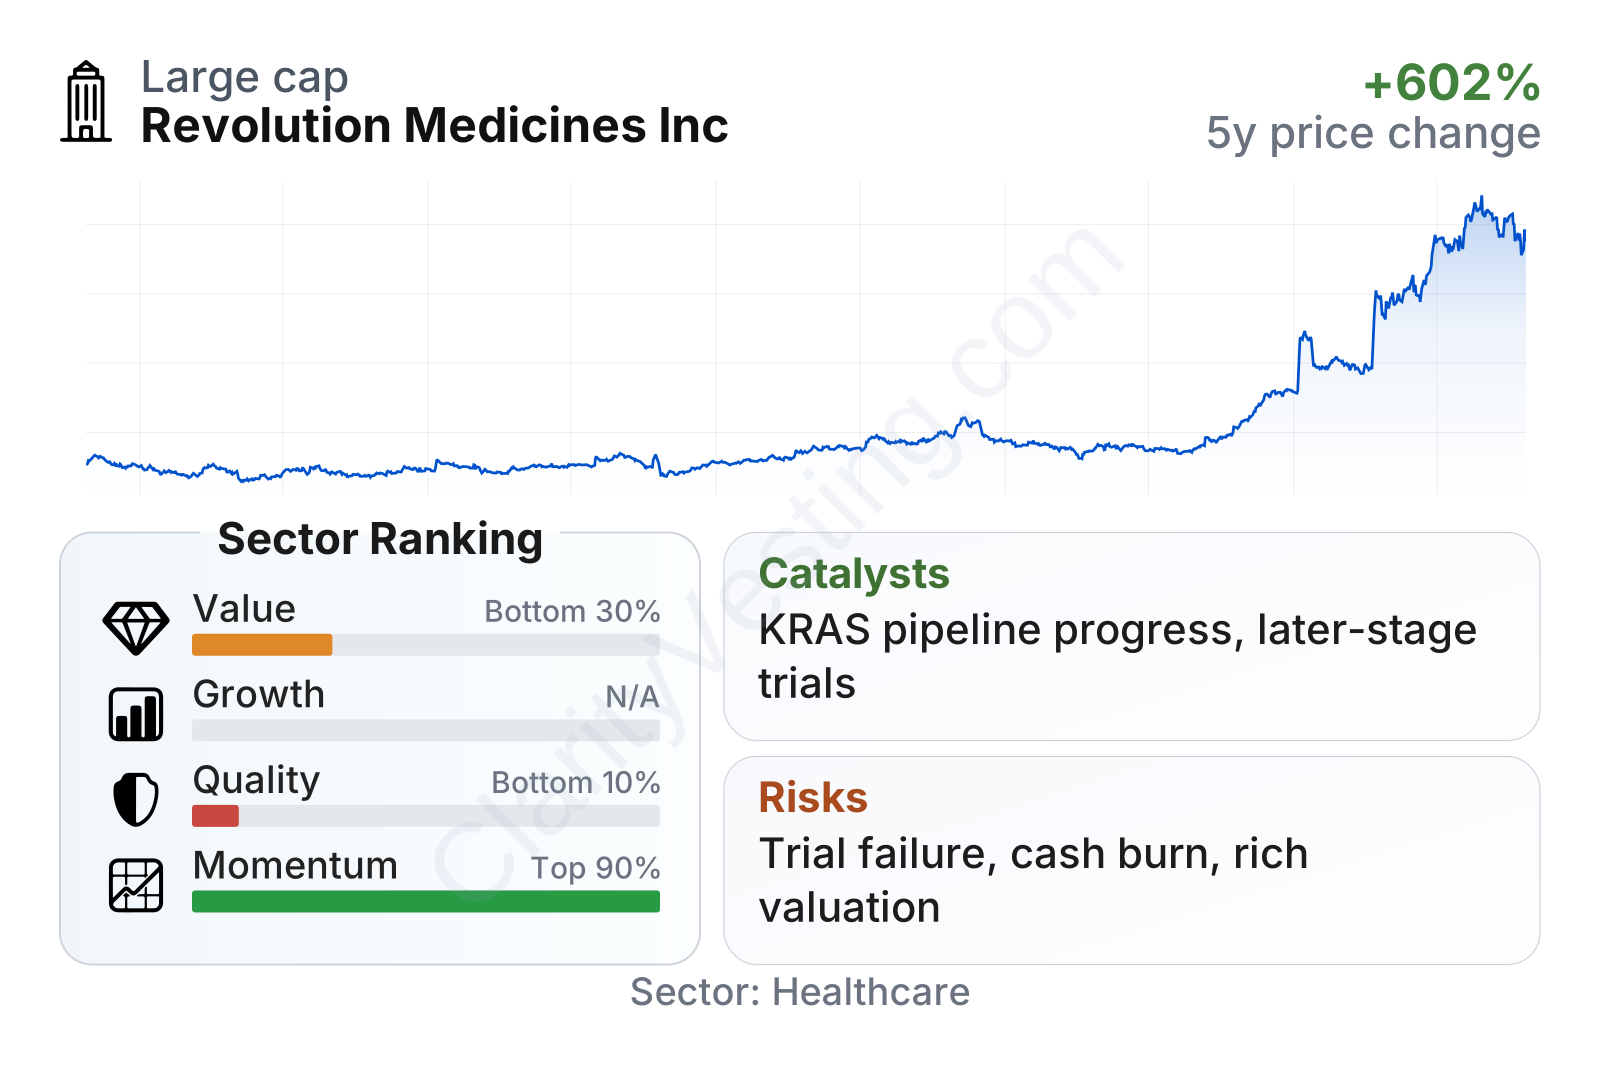
The table points to an unusual combination: very weak current fundamentals but extremely strong market momentum. Valuation measures sit near the weaker end of the healthcare group because the company has no earnings, no dividend, and negative free cash flow, while price-to-book is far above the sector median. At the same time, share-price performance has been exceptionally strong over 6 months, 12 months, and 3 years, showing that the market has been rewarding clinical and pipeline expectations rather than current financial output.
Revolution Medicines is now a large-cap biotech by market value, but its operating profile still looks like a pre-commercial research company. Beta is above 1, which suggests the shares have tended to move more sharply than the broader market. That is common in biotech, especially when valuation is shaped by trial updates and pipeline milestones.
Growth
The company operates in one of the most attractive areas of modern oncology. Precision cancer medicine remains a major growth field because it aims to match drugs with specific tumor mutations, improving the odds of meaningful clinical benefit. Within that area, RAS-targeted therapy is especially important. KRAS mutations are among the most common drivers in solid tumors, including lung, pancreatic, and colorectal cancers, so a successful platform in this category could address very large patient populations.
Revolution Medicines’ strategy is coherent for long-term growth because it is not centered on a single molecule alone. The company has built a broader franchise around RAS biology, including programs that seek to inhibit active RAS states and combinations that may widen the treatable patient pool beyond earlier generation approaches. If that platform works clinically, it could support several drug candidates and multiple tumor types rather than one narrow commercial opportunity.
Revenue growth has been highly volatile and is not the best way to judge progress here. In a development-stage biotech, reported revenue can swing sharply depending on collaboration accounting rather than underlying medical progress. For Revolution Medicines, the more relevant growth indicators are pipeline advancement, expansion into later-stage trials, and the potential commercial size of its lead assets.
A major visible catalyst is the company’s lead KRAS-focused program portfolio, especially assets being studied in lung and pancreatic cancer settings with significant unmet need. Recent corporate updates have continued to emphasize broad clinical development, combination strategies, and preparation for larger studies. The market’s sharp re-rating in 2026 suggests investors have been responding to perceived improvement in the commercial potential of those programs.
Free cash flow has moved deeper into negative territory as development spending has accelerated. On one hand, that is a sign of heavier investment in the pipeline. On the other hand, it shows how much future success is already being funded upfront. For a company at this stage, cash burn is not automatically a weakness, but it does raise the importance of execution and financing durability.
Risks
This article is for informational purposes only and does not constitute financial advice. Some content is AI-generated. See Disclaimer


