Stock Analysis · RTX Corporation (RTX)
Overview
RTX Corporation is one of the largest aerospace and defense groups in the world. It sells aircraft engines, aviation systems, replacement parts, maintenance services, air defense systems, missiles, radar, sensors, and a wide range of military and commercial aerospace equipment. The company operates through three main businesses: Collins Aerospace, Pratt & Whitney, and Raytheon. In simple terms, RTX is exposed to two major markets at once: civil aviation, which benefits from airline traffic and aircraft production, and defense, which benefits from government military spending.
Its revenue mix is relatively balanced across these businesses, which helps reduce dependence on a single program or end market. Based on the latest full-year company reporting, the main sources of revenue are approximately:
- Collins Aerospace: about 33% of revenue. This unit provides avionics, aircraft interiors, mission systems, aerostructures, connected aviation products, and aftermarket services for commercial and military aircraft.
- Pratt & Whitney: about 31% of revenue. This segment is centered on aircraft engines, especially geared turbofan engines for narrow-body jets, plus military engines and long-term maintenance work.
- Raytheon: about 30% of revenue. This business supplies missiles, air and missile defense systems, advanced sensors, command-and-control systems, and other defense electronics.
- Other activities and eliminations: about 6%. This includes smaller corporate items and accounting adjustments between segments.
The business model is especially attractive because a large share of sales does not come only from one-time equipment deliveries. RTX also generates recurring revenue from spare parts, repairs, maintenance, and long-duration defense programs. That tends to make results more resilient than a pure manufacturing business.
The long-term financial picture has also improved after a difficult period in 2023. Revenue has climbed strongly since 2021, while operating profit and net income recovered meaningfully in 2024 and 2025. That pattern suggests the company has been working through disruptions rather than facing a structurally shrinking business.
Over the last several years, sales have moved higher at a solid pace, and profit recovered after a sharp dip in 2023. The most notable point is that earnings have rebounded faster than revenue, which usually signals improving execution and better absorption of fixed costs.
Key Figures
| Metric | Value | Sector ⓘ |
|---|---|---|
| Date | Oct 03, 2026 | |
| Context | ||
| Sector | Industrials | |
| Industry | Aerospace & Defense | |
| Market Cap ⓘ | $251.95B | |
| Beta ⓘ | 0.29 | |
Value (Cheapness) | ||
| P/E Ratio ⓘ | 33.03 | 22.45 |
| P/B Ratio ⓘ | 3.92 | 1.98 |
| FCF Yield ⓘ | 4.77% | 6.31% |
| Dividend Yield ⓘ | 1.48% | 1.96% |
| EBIT / EV ⓘ | 4.05% | 4.81% |
| PEG ⓘ | 2.21 | |
Growth (Business expansion) | ||
| Revenue Growth ⓘ | 14.50% | 9.10% |
| RPS Growth (5Y CAGR) ⓘ | 11.22% | 7.75% |
| EPS Growth (5Y CAGR) ⓘ | -6.86% | -13.59% |
| BVPS Growth (5Y CAGR) ⓘ | -0.36% | 6.22% |
| Margin Growth (5Y Trend) ⓘ | 1.93% | 0.72% |
| FCF Growth (5Y CAGR) ⓘ | 13.71% | 10.98% |
| DPS Growth (5Y CAGR) ⓘ | 7.68% | 9.48% |
Quality (Business durability) | ||
| ROIC (Latest) ⓘ | 9.16% | 10.92% |
| ROA (Latest) ⓘ | 4.52% | 5.41% |
| ROIC (5Y Median) ⓘ | 6.18% | 9.21% |
| ROA (5Y Median) ⓘ | 2.94% | 4.94% |
| Net Debt / EBIT (Latest) ⓘ | 2.62 | 2.07 |
| Net Debt / EBIT (5Y Median) ⓘ | 3.93 | 2.28 |
| Net Debt / EBITDA (Latest) ⓘ | 1.90 | 1.43 |
| Net Debt / Assets ⓘ | 17.56% | 19.27% |
| EBITDA / Interest ⓘ | 9.53 | 9.53 |
| Operating Margin (Latest) ⓘ | 12.48% | 10.50% |
| Operating Margin (5Y Median) ⓘ | 10.11% | 10.27% |
| Debt to Equity (Latest) ⓘ | 58.54% | 65.48% |
| Profit Margin (Latest) ⓘ | 8.28% | 6.62% |
| Free Cash Flow (Latest) ⓘ | $12.02B | |
Momentum (Price trend) | ||
| 3Y Return ⓘ | +173.85% | +58.56% |
| 12M Return (excl. last month) ⓘ | +32.92% | +15.63% |
| 6M Return ⓘ | -3.04% | +4.19% |
| Price vs. 200-Day MA ⓘ | -4.18% | +0.93% |
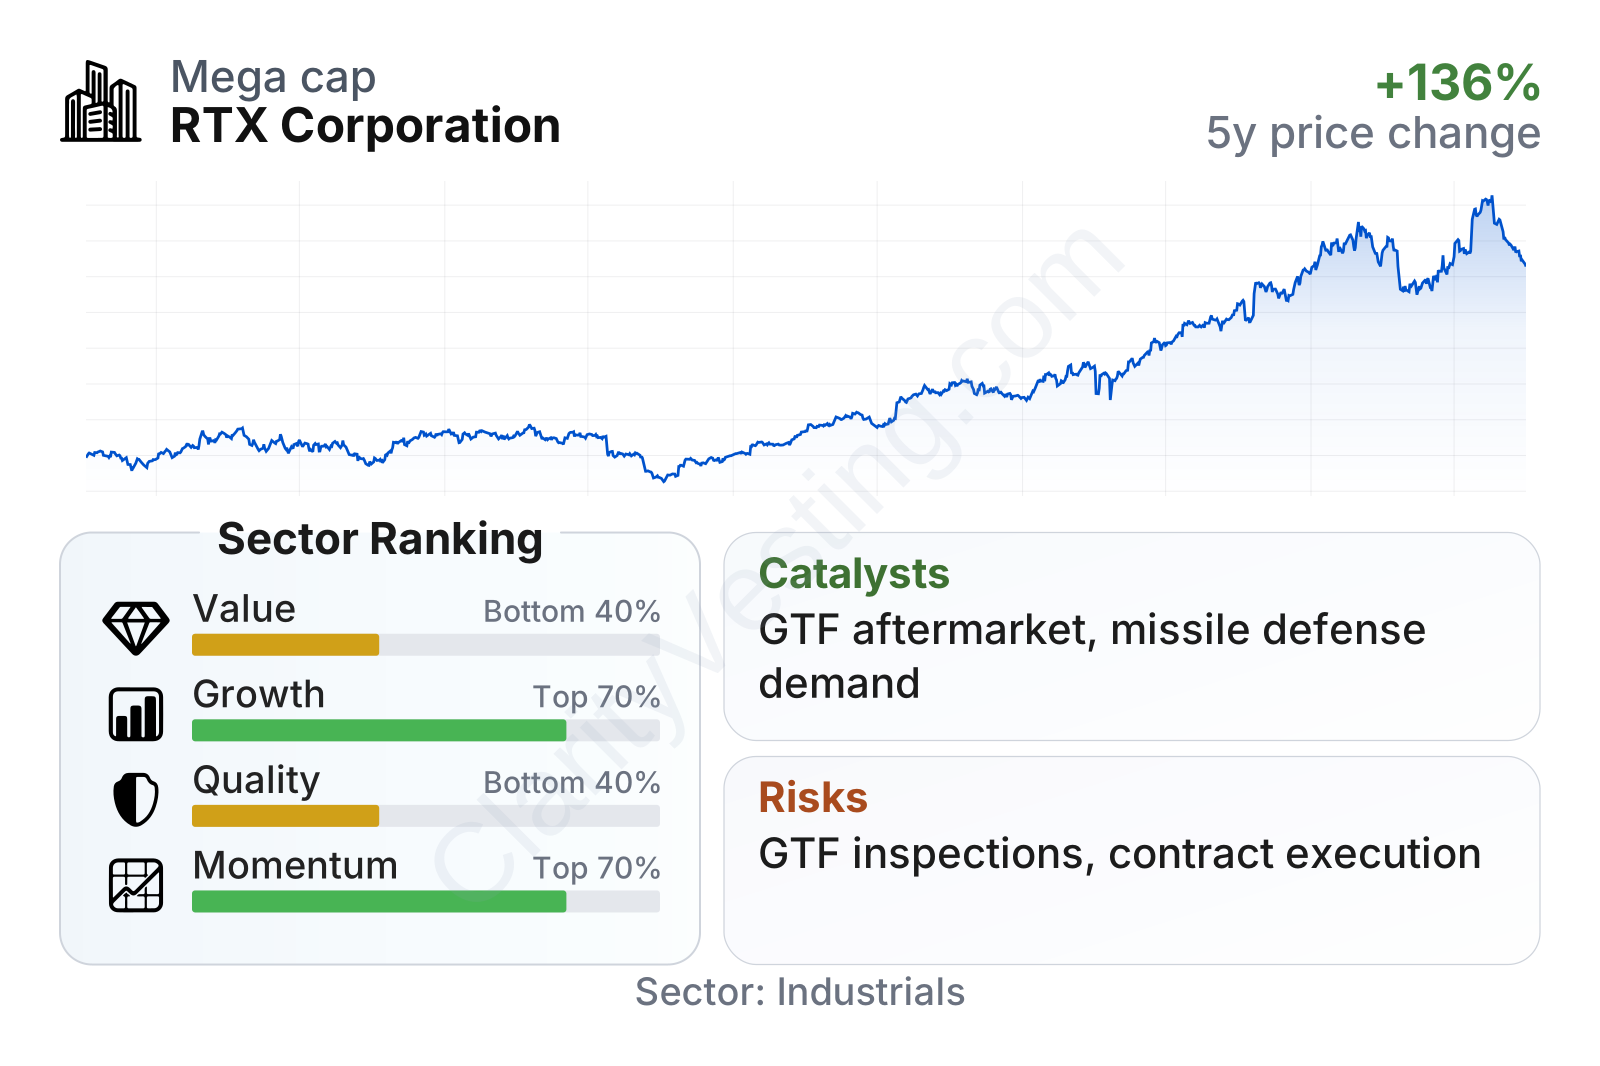
RTX is a very large aerospace and defense company with unusually low share-price volatility for an industrial stock, as shown by its low beta. Its growth and market momentum rank above much of the sector, helped by double-digit revenue expansion and a strong multiyear stock advance. The weaker area is valuation: earnings and book-value multiples are clearly above sector norms, while cash flow yield and dividend yield are below the median. Quality is mixed rather than weak across the board. Operating margin and net margin are healthy, but returns on capital remain below many peers and leverage metrics are not especially conservative.
Growth
RTX operates in a sector with durable long-term demand drivers. On the commercial aerospace side, global air travel has continued to normalize and expand, which supports aircraft utilization, maintenance activity, and demand for spare parts. On the defense side, many governments are increasing military budgets because of rising geopolitical tensions, missile-defense needs, and the need to replenish inventories. That combination gives RTX exposure to two markets with favorable structural support.
The company’s strategy also makes sense for future expansion because it is built around installed bases. Once an engine, avionics suite, or defense system is selected, the customer often remains tied to RTX for years through servicing, upgrades, and replacement components. This is particularly important at Pratt & Whitney and Collins Aerospace, where aftermarket revenue can become more profitable over time than the original equipment sale.
Recent revenue growth has been clearly stronger than the sector median, although the path has not been perfectly smooth. One quarter in 2023 was heavily distorted by operational issues, but the broader trend since then points to a return to healthy expansion, with growth recently back in the low- to mid-teens range.
A key catalyst is the geared turbofan engine franchise at Pratt & Whitney. While this program has faced well-known disruption from inspection and durability issues, it also creates a very large installed base that should translate into years of maintenance work and parts demand. In parallel, Collins Aerospace benefits from broad aircraft content exposure rather than dependence on a single platform, and Raytheon is positioned in categories such as missile defense and advanced sensors that remain priorities for many defense customers.
Another favorable sign is cash generation. Stronger cash flow matters because it gives management more flexibility for debt reduction, dividends, share repurchases, and reinvestment.
Free cash flow has improved materially from the lower levels seen earlier in the cycle and now sits at a high absolute level. That supports the view that RTX’s recent earnings recovery is being backed by real cash rather than accounting gains alone.
Recent company updates have also pointed to ongoing demand strength in commercial aftermarket activity and sustained defense orders. The broader setup is therefore not dependent on a single short-lived event; it is supported by fleet usage, production demand, and elevated defense spending across multiple countries.
Risks
This article is for informational purposes only and does not constitute financial advice. Some content is AI-generated. See Disclaimer


