Stock Analysis · Reliance Steel & Aluminum Co (RS)
Overview
Reliance Steel & Aluminum Co. is one of the largest metals service center companies in North America. Rather than operating mainly as a primary steelmaker, it buys metal from producers, processes it, and sells smaller, customized orders to a wide range of customers. Its role is closer to a value-added distributor than a commodity producer: customers often need cutting, sawing, machining, tubing, fabrication, inventory management, and just-in-time delivery, and Reliance builds its business around those services.
The company serves many end markets, including aerospace, non-residential construction, transportation, heavy industry, energy, semiconductor equipment, and consumer products. This diversification matters because it reduces dependence on any single industry and gives Reliance a broader base of demand than many more specialized metals companies.
Revenue mainly comes from the sale of metal products and related processing services. Based on company disclosures, the mix is spread across a very large product catalog rather than a small number of business lines. The most important revenue sources can be summarized as follows:
- Carbon steel products: approximately 45% to 50% of sales in recent years. This includes plate, beams, structural items, tubing, and general steel products used across construction, manufacturing, and industrial applications.
- Aluminum products: approximately 15% to 20% of sales. These products serve aerospace, transportation, general manufacturing, and other precision applications.
- Stainless steel products: approximately 10% to 15% of sales, including corrosion-resistant products used in industrial, food, chemical, and energy-related applications.
- Alloy steel and specialty metals: approximately 20% to 25% of sales. This category includes higher-value products such as specialty alloys, bar, plate, tubing, and products aimed at demanding sectors such as aerospace and energy.
- Processing and other services: a smaller but economically important share embedded across product sales, because value-added fabrication and rapid delivery help support pricing and customer retention.
Over the last several years, the business has shown a clear pattern: revenue surged during the favorable pricing environment of 2021 and 2022, then normalized as metal prices softened. Even so, gross profit remained substantial, which suggests the company’s processing model still provides some resilience when the cycle cools.
The long-term pattern here is less about straight-line growth and more about cycle management. Revenue and earnings peaked during the metals upswing, but the business continued to generate meaningful profit through the downturn, helped by its broad customer base and disciplined cost structure.
Key Figures
| Metric | Value | Sector ⓘ |
|---|---|---|
| Date | Oct 24, 2026 | |
| Context | ||
| Sector | Basic Materials | |
| Industry | Steel | |
| Market Cap ⓘ | $21.30B | |
| Beta ⓘ | 0.95 | |
Value (Cheapness) | ||
| P/E Ratio ⓘ | 24.25 | 16.92 |
| P/B Ratio ⓘ | 2.80 | 1.66 |
| FCF Yield ⓘ | 2.31% | 5.83% |
| Dividend Yield ⓘ | 1.18% | 2.07% |
| EBIT / EV ⓘ | 4.58% | 6.38% |
| PEG ⓘ | 2.29 | |
Growth (Business expansion) | ||
| Revenue Growth ⓘ | 26.50% | 11.25% |
| RPS Growth (5Y CAGR) ⓘ | 5.40% | 4.49% |
| EPS Growth (5Y CAGR) ⓘ | -22.64% | -15.24% |
| BVPS Growth (5Y CAGR) ⓘ | 9.41% | 5.49% |
| Margin Growth (5Y Trend) ⓘ | -7.24% | -1.54% |
| FCF Growth (5Y CAGR) ⓘ | -2.79% | 0.37% |
| DPS Growth (5Y CAGR) ⓘ | 15.03% | 5.91% |
Quality (Business durability) | ||
| ROIC (Latest) ⓘ | 10.71% | 9.59% |
| ROA (Latest) ⓘ | 6.42% | 4.92% |
| ROIC (5Y Median) ⓘ | 15.58% | 7.91% |
| ROA (5Y Median) ⓘ | 12.84% | 3.92% |
| Net Debt / EBIT (Latest) ⓘ | 1.75 | 1.36 |
| Net Debt / EBIT (5Y Median) ⓘ | 0.77 | 1.69 |
| Net Debt / EBITDA (Latest) ⓘ | 1.45 | 0.93 |
| Net Debt / Assets ⓘ | 14.81% | 13.69% |
| EBITDA / Interest ⓘ | 24.20 | 12.38 |
| Operating Margin (Latest) ⓘ | 8.06% | 13.24% |
| Operating Margin (5Y Median) ⓘ | 12.03% | 11.82% |
| Debt to Equity (Latest) ⓘ | 25.46% | 40.30% |
| Profit Margin (Latest) ⓘ | 5.66% | 6.38% |
| Free Cash Flow (Latest) ⓘ | $491.90M | |
Momentum (Price trend) | ||
| 3Y Return ⓘ | +79.34% | +73.47% |
| 12M Return (excl. last month) ⓘ | +35.60% | +27.59% |
| 6M Return ⓘ | +26.12% | -4.02% |
| Price vs. 200-Day MA ⓘ | +16.03% | -0.65% |
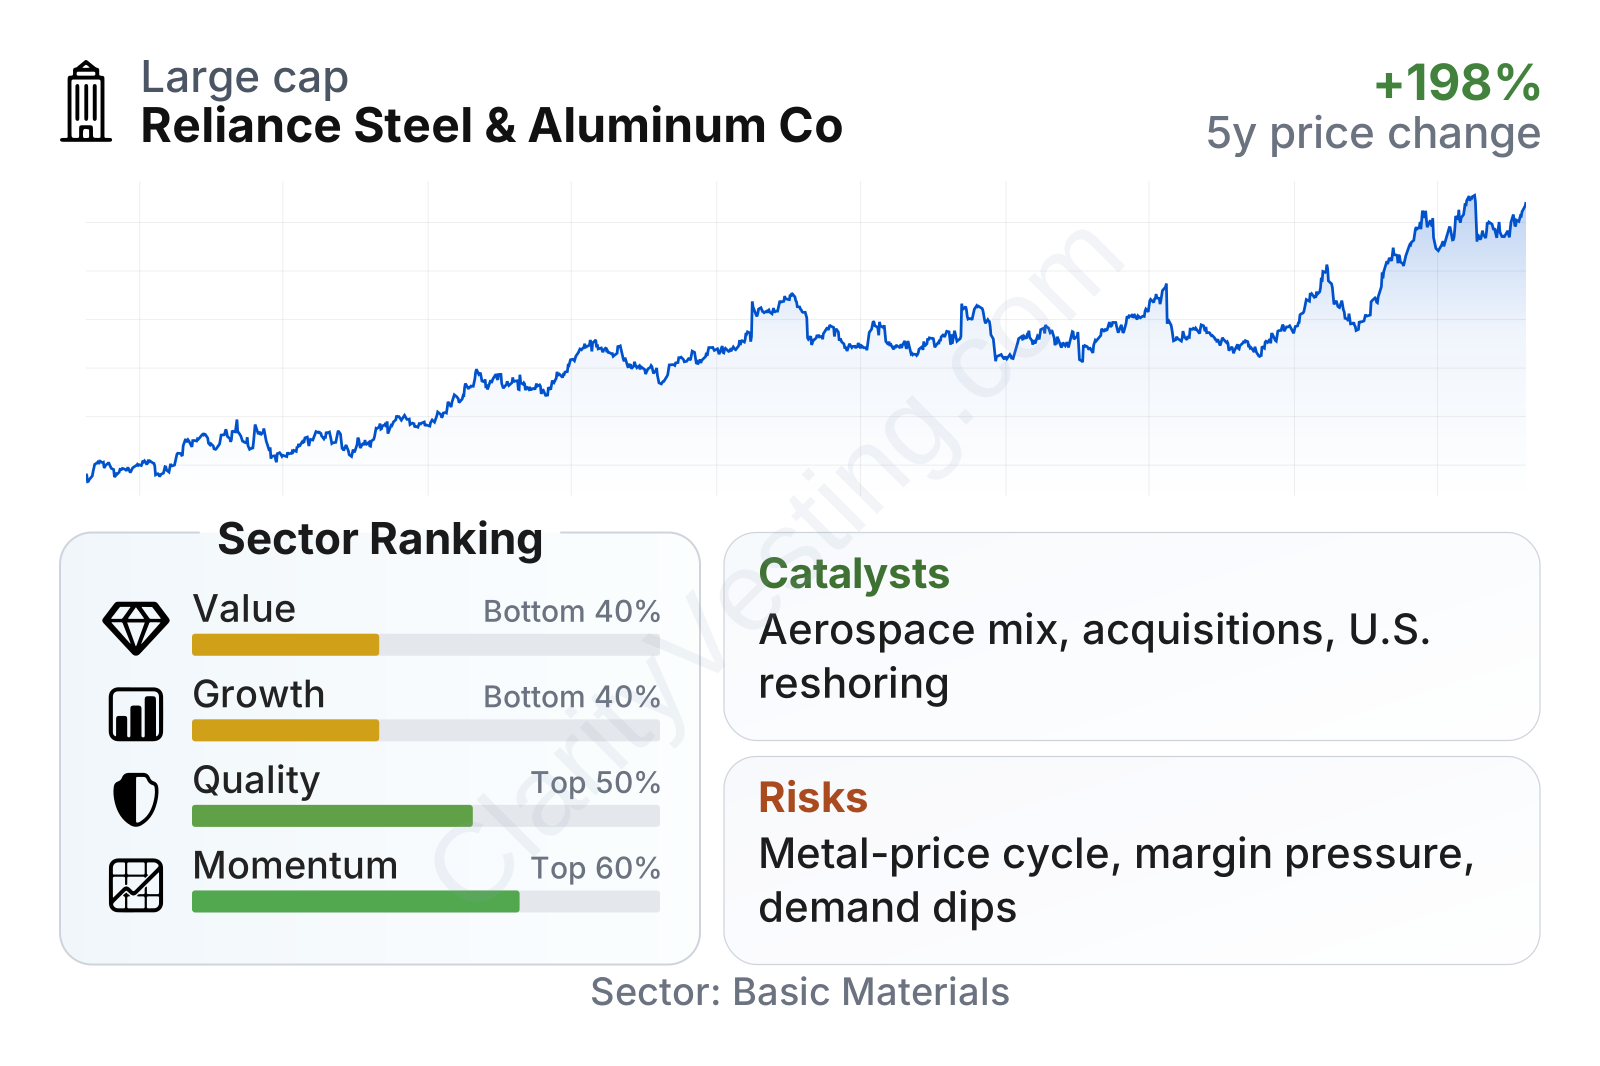
Reliance is a large company within the metals distribution space, with share-price volatility that has been close to the broader market rather than extremely high for a cyclical materials name. The quality profile looks better than many peers, especially in returns on capital and balance-sheet discipline. By contrast, the value and growth factors appear weaker at the moment: the stock trades above sector median multiples, while earnings and cash-flow growth over multi-year periods have been pressured by the post-peak normalization in metals markets.
Recent price momentum has been strong, especially over the last 6 to 12 months, but that market strength has not been matched by equally strong margin or free-cash-flow trends. That gap is important because it means the market is giving substantial credit to stabilization and future recovery rather than current peak profitability.
Growth
Reliance operates in a sector that is mature but still capable of long-term expansion through consolidation, value-added services, and exposure to industrial niches that require precision metals processing. Steel distribution itself is not a high-growth industry in the way software or biotech can be, yet demand tends to track industrial production, infrastructure, construction activity, aerospace build rates, and domestic manufacturing investment. That creates a practical kind of growth: not explosive, but potentially durable when supported by the right operating model.
The company’s strategy is coherent for that environment. Reliance has long expanded through acquisitions of specialized service centers, then kept those businesses close to their customers while using the scale of a much larger group. That combination of local market presence and national purchasing power is one of the main reasons the company has remained relevant across many end markets. It also helps when customers want reliability, available inventory, and secondary processing rather than just the lowest raw metal price.
Recent revenue trends suggest the downcycle may have passed its worst point. After a prolonged stretch of year-over-year declines through 2023 and 2024, growth turned positive in 2025 and strengthened further into 2026, reaching the mid-20% range in the most recent period shown. That rebound stands well above the sector median and points to improving demand, firmer pricing, acquisitions, or a combination of all three.
Cash generation is still positive but has moved down from the much stronger levels seen earlier in the cycle. Free cash flow remains meaningful in absolute terms, yet the trend shows that a recovery in revenue has not fully translated into a recovery in cash production. For a distributor, this often reflects working-capital needs, especially inventory and receivables, during periods of changing demand and pricing.
Several catalysts could support future growth. Aerospace remains a particularly attractive market because it tends to require high-specification metals and can carry better margins than more commoditized end uses. U.S. manufacturing investment, grid and infrastructure spending, and onshoring of industrial supply chains may also increase demand for processed metal products. In addition, Reliance’s acquisition model can continue to add growth in a fragmented industry where many smaller operators may still be potential targets.
Recent company communications have also emphasized continued capital spending on processing capabilities and targeted acquisitions. That matters because it supports a shift toward more specialized work, where speed, customization, and service quality can be more important than spot metal prices alone.
Risks
This article is for informational purposes only and does not constitute financial advice. Some content is AI-generated. See Disclaimer


