Stock Analysis · Royalty Pharma Plc (RPRX)
Overview
Royalty Pharma Plc is a healthcare financing company focused on biopharmaceutical royalties. Instead of discovering and selling drugs itself, it provides capital to drug developers, universities, research hospitals, and other royalty owners in exchange for a share of future sales from approved medicines or promising drug candidates. In simple terms, it operates like a specialized investor in pharmaceutical intellectual property.
This model makes Royalty Pharma different from a typical biotech company. Its results depend less on running laboratories or launching its own sales force, and more on selecting valuable therapies, structuring deals well, and building a large portfolio of royalty interests across many medicines and disease areas.
Its revenue mainly comes from payments tied to the sales of partnered therapies. Based on company reporting, the business is primarily organized around royalty receipts from marketed products, with smaller contributions from development-stage and milestone-related economics. The largest revenue exposures are generally tied to a concentrated group of established blockbuster medicines.
The main revenue sources can be summarized as follows:
- Royal receipts from marketed products: the clear majority of revenue, typically well above 90%. This includes royalties linked to commercial drug sales across oncology, rare disease, immunology, neurology, and cystic fibrosis.
- Milestones and other contractual receipts: a small share, usually in the low single-digit percentage range depending on the year. These can include one-time payments when partnered products hit regulatory, launch, or sales targets.
- Returns from development-stage interests and other portfolio items: a minor portion that can fluctuate meaningfully from period to period.
Looking at the underlying products, Royalty Pharma has historically drawn meaningful cash flow from a diversified list that has included cystic fibrosis therapies from Vertex, Trelegy, Xtandi, Evrysdi, Tremfya, Cabometyx, Spinraza, and other specialty medicines. No single business line like manufacturing or distribution dominates because the company does not operate that way; the portfolio itself is the engine.
The business structure is attractive because operating costs are relatively light compared with traditional drug makers. That can produce very high operating margins when royalty collections are healthy, although reported earnings can still move around due to non-cash valuation changes, deal activity, and accounting adjustments.
The income flow over recent years shows a business with consistently strong gross profitability and relatively limited day-to-day operating cost needs. Revenue has not moved in a straight line, but the model has repeatedly converted a large portion of incoming royalty cash into operating income and free cash flow.
Key Figures
| Metric | Value | Sector ⓘ |
|---|---|---|
| Date | Oct 03, 2026 | |
| Context | ||
| Sector | Healthcare | |
| Industry | Biotechnology | |
| Market Cap ⓘ | $33.72B | |
| Beta ⓘ | 0.43 | |
Value (Cheapness) | ||
| P/E Ratio ⓘ | 31.38 | 24.06 |
| P/B Ratio ⓘ | 8.27 | 3.08 |
| FCF Yield ⓘ | 8.83% | 3.07% |
| Dividend Yield ⓘ | 1.56% | 2.05% |
| EBIT / EV ⓘ | 5.20% | 0.63% |
| PEG ⓘ | 1.34 | |
Growth (Business expansion) | ||
| Revenue Growth ⓘ | 16.50% | 7.50% |
| RPS Growth (5Y CAGR) ⓘ | -6.33% | 8.70% |
| EPS Growth (5Y CAGR) ⓘ | -8.67% | -18.20% |
| BVPS Growth (5Y CAGR) ⓘ | -19.71% | 3.95% |
| Margin Growth (5Y Trend) ⓘ | 7.15% | -0.58% |
| FCF Growth (5Y CAGR) ⓘ | 5.39% | 0.88% |
| DPS Growth (5Y CAGR) ⓘ | -0.42% | 6.80% |
Quality (Business durability) | ||
| ROIC (Latest) ⓘ | 7.06% | 3.29% |
| ROA (Latest) ⓘ | 4.16% | 3.02% |
| ROIC (5Y Median) ⓘ | 6.13% | 4.75% |
| ROA (5Y Median) ⓘ | 4.07% | 1.93% |
| Net Debt / EBIT (Latest) ⓘ | 4.76 | 1.33 |
| Net Debt / EBIT (5Y Median) ⓘ | 5.11 | 1.83 |
| Net Debt / EBITDA (Latest) ⓘ | 4.75 | 0.99 |
| Net Debt / Assets ⓘ | 41.12% | 5.33% |
| EBITDA / Interest ⓘ | 4.75 | 9.63 |
| Operating Margin (Latest) ⓘ | 67.47% | 9.25% |
| Operating Margin (5Y Median) ⓘ | 61.47% | 7.80% |
| Debt to Equity (Latest) ⓘ | 131.16% | 28.99% |
| Profit Margin (Latest) ⓘ | 32.02% | 3.60% |
| Free Cash Flow (Latest) ⓘ | $2.98B | |
Momentum (Price trend) | ||
| 3Y Return ⓘ | +132.06% | +37.48% |
| 12M Return (excl. last month) ⓘ | +76.57% | +20.85% |
| 6M Return ⓘ | +19.86% | +9.73% |
| Price vs. 200-Day MA ⓘ | +13.73% | +4.69% |
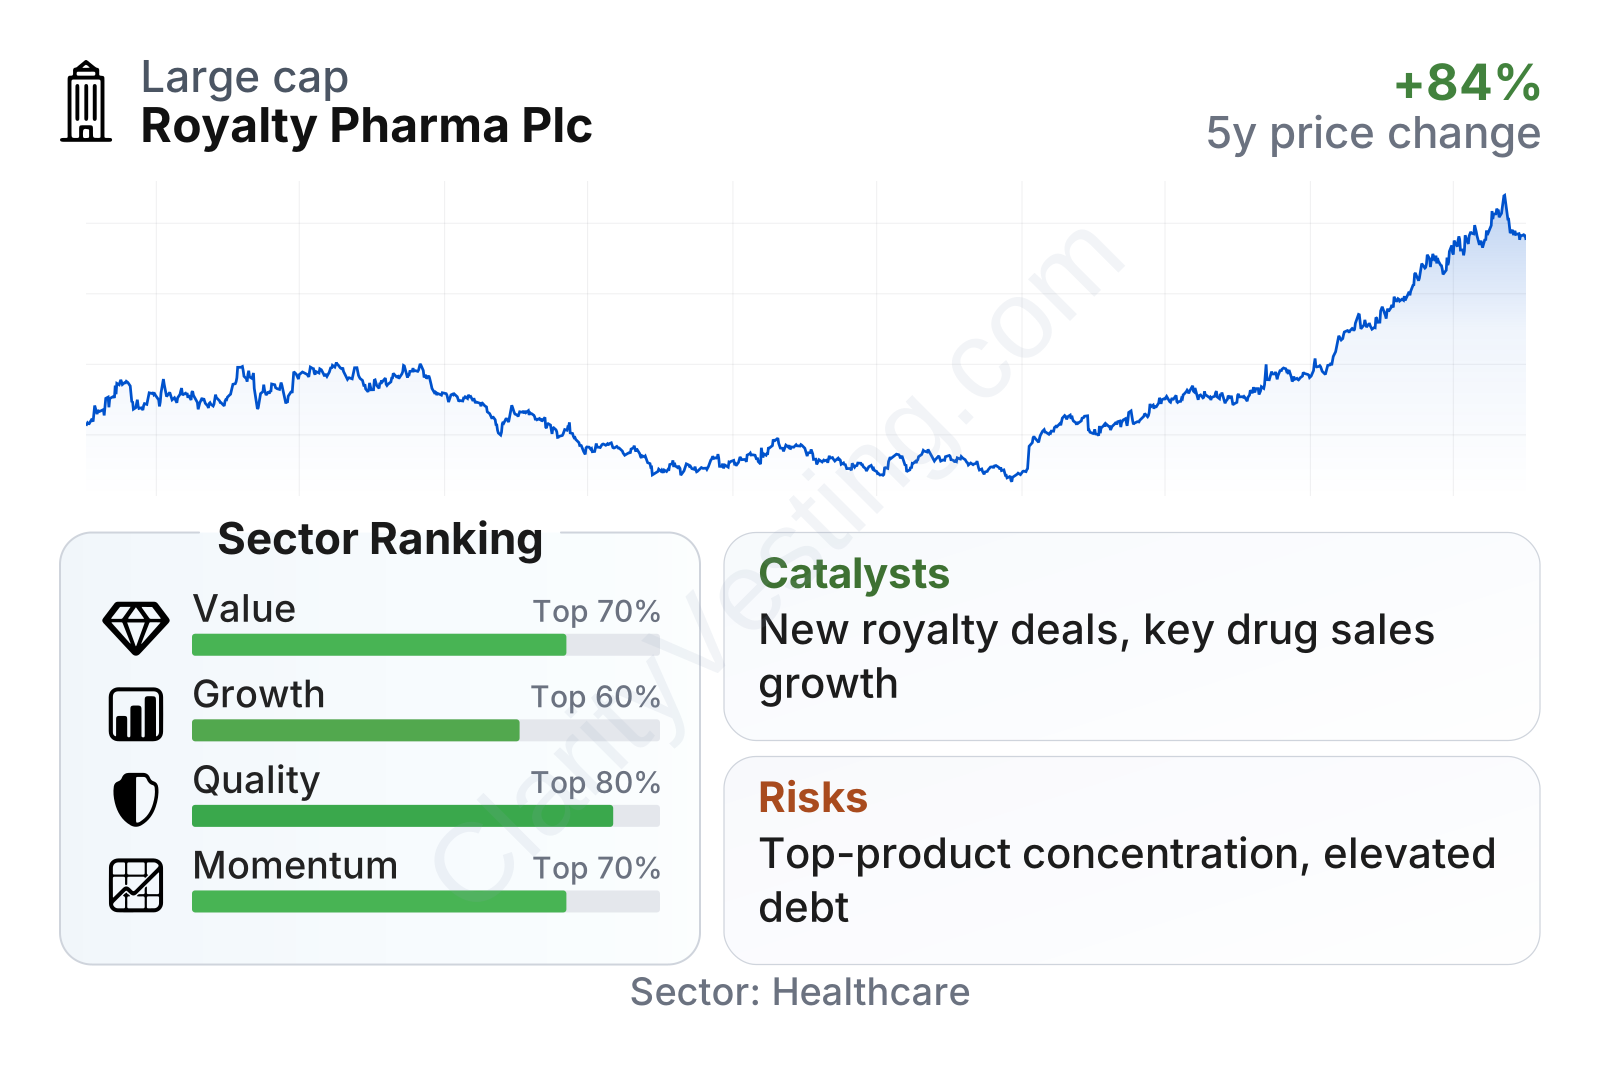
Royalty Pharma stands out as a large healthcare company with unusually strong profitability for the biotech group and relatively low share-price volatility, as reflected by its beta well below 1. On valuation, the shares trade above the sector median on earnings and book value multiples, but cash generation looks stronger than many peers, with free cash flow yield and EBIT relative to enterprise value comfortably ahead of sector norms. Growth metrics are mixed: recent revenue growth is better than the sector median, while longer-term per-share growth has been less consistent. Overall, the company ranks better on quality and cash production than on deep-value measures.
Growth
Royalty Pharma operates in a part of healthcare that benefits from long-term industry tailwinds. Global demand for innovative medicines continues to rise as populations age, rare disease treatment expands, oncology remains a major focus, and new biologics and specialty therapies command large commercial markets. As drug developers seek non-dilutive funding and universities look to monetize intellectual property, the company’s role as a large-scale royalty buyer remains relevant.
Its strategy also makes sense for future growth. Rather than betting everything on one internal pipeline, Royalty Pharma spreads capital across many products, companies, and therapeutic areas. That reduces binary clinical risk compared with a traditional biotech model, while still giving it exposure to new launches and label expansions. The company can also deploy capital when biotech funding markets are weak, which may create better deal terms.
Revenue growth has been uneven from quarter to quarter, which is normal for a royalty-based model, but the most recent trend has improved. Recent year-over-year growth has moved into the low-to-mid teens, clearly ahead of the broader sector median. That suggests the current portfolio is still producing growth despite the natural aging of some mature products.
Free cash flow has remained robust, holding around the mid-$2 billion range over the last several years. That stability matters because it gives the company flexibility to fund new royalty acquisitions, service debt, repurchase shares, and pay dividends without depending on equity issuance.
A major catalyst for future expansion is capital deployment. Royalty Pharma’s business can accelerate when it closes large royalty transactions tied to important therapies with long market runways. Another catalyst is the continued growth of key partnered products, especially blockbuster drugs in rare disease, oncology, and immunology. Additional upside can also come from new indications for already partnered medicines, since broader use can raise sales without Royalty Pharma having to build anything operationally.
Recent company updates have continued to emphasize portfolio expansion, active dealmaking, and confidence in long-duration cash flows from core assets. For this company, the most important “news” is often not a headline-grabbing event but the steady addition of new royalty interests and the commercial progress of products already in the portfolio.
Risks
This article is for informational purposes only and does not constitute financial advice. Some content is AI-generated. See Disclaimer


